A sunburst chart transforms hierarchical data into an intuitive, circular visualization where each ring represents a level in your data hierarchy. Excel users from version 2019 onward can create these dynamic charts to display complex relationships, from organizational structures to budget allocations. This tutorial walks you through creating and customizing a sunburst chart, complete with interactive elements and real-time data connections.
Create Your First Sunburst Chart in Excel
Let’s start with a basic example using a company’s sales data structure:
Format Your Data Structure
Your data must follow a hierarchical structure for the sunburst chart to work correctly. Here’s how to organize it:
- Open a new Excel worksheet
- Create column headers using this structure:
|
Region |
Country |
Product |
Sales |
|---|---|---|---|
|
North America |
USA |
Laptops |
50000 |
|
North America |
USA |
Tablets |
30000 |
|
Europe |
Germany |
Laptops |
40000 |
|
Europe |
France |
Tablets |
25000 |
- Verify hierarchy levels
- Each column represents a level in your chart
- Arrange from broadest (left) to most specific (right)
- Include numerical values in the rightmost column
Select and Insert the Chart
- Select your data range
- Click and drag to highlight all cells including headers
- Ensure no blank rows or columns are selected
- Navigate to the Insert tab
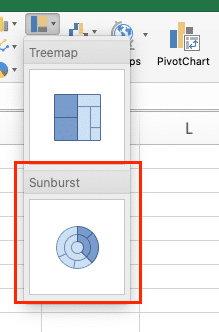
- Click Insert > Charts > Hierarchy

-
- Select Sunburst from the options
- Verify initial visualization
- Check that all levels appear as concentric rings
- Confirm data hierarchy flows from center outward
Customize Your Sunburst Chart Design
Apply Colors and Labels
- Modify color schemes:
- Right-click any segment
- Select Format Data Series

-
- Choose from preset color schemes or create custom colors:
|
Level |
Suggested Colors |
Purpose |
|---|---|---|
|
Center |
Dark shades |
Root level visibility |
|
Middle |
Medium tones |
Clear differentiation |
|
Outer |
Light shades |
Detailed data emphasis |
- Format labels:
- Click Chart Design > Add Chart Element > Data Labels

-
- Choose from these options:
|
Label Type 
Try the Free Spreadsheet Extension Over 500,000 Pros Are Raving About
Stop exporting data manually. Sync data from your business systems into Google Sheets or Excel with Coefficient and set it on a refresh schedule. Get Started |
Best Use Case |
|---|---|
|
Category |
Show names only |
|
Value |
Display numbers |
|
Percentage |
Show proportions |
|
Combined |
Full detail view |
Work with Chart Elements
- Adjust segment sizes:
Copy
Right-click > Format Data Series > Series Options
– Angle: Controls segment spread (0-360 degrees)
– Hole size: Adjusts center opening (0-100%)
- Add hover effects:
- Select the chart
- Click Format > Shape Effects
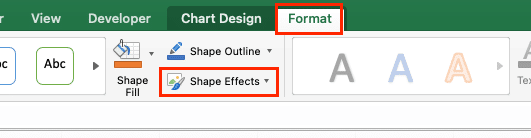
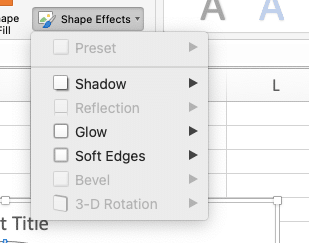
- Choose from:
- Shadow
- Glow
- Soft edges
- 3-D rotation
Add Interactive Elements
Create Drill-Down Capabilities
- Enable selection:
Copy
Click chart > Format > Selection Pane
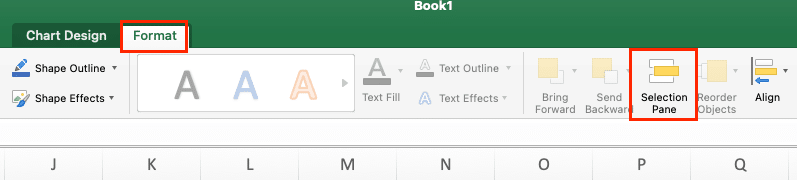
– Toggle visibility of specific levels
– Group related segments
- Add interactivity:
- Right-click > Format Data Series
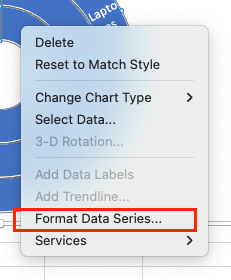
- Enable these options:
- Explosion: Separate segments on click
- Rotation: Allow manual segment adjustment
Link to External Data
- Connect to data sources:
- Click Data > Get Data
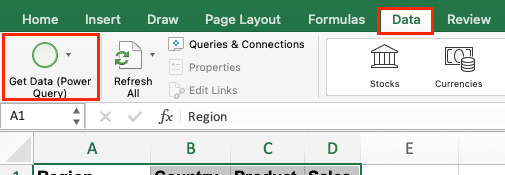
- Choose your source:
- Excel workbooks
- Databases
- Cloud services
- Set up refresh parameters:
- Click Data > Refresh All
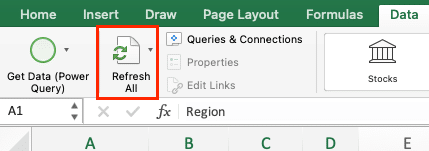
- Configure refresh settings:
- Manual refresh
- Automatic refresh (time-based)
- Refresh on file open
Next Steps
You’ve learned to create a professional sunburst chart in Excel, from basic setup to advanced customization. To take your data visualization to the next level, consider automating your charts with real-time data.
Ready to supercharge your Excel dashboards with live data? Get started with Coefficient to automatically sync your business data directly into your spreadsheets, ensuring your sunburst charts always display the latest information.


