
Excel’s quartile functions help you divide your data into four equal parts, making it easier to understand data distribution and identify patterns. Whether you’re analyzing sales performance, survey responses, or any numerical dataset, mastering quartile calculations is essential for effective data analysis. Let’s explore how to use these functions effectively in Excel 2021-2024.
Calculate Quartiles in Excel Using the QUARTILE Function
The QUARTILE function in Excel comes in two variants: QUARTILE.INC and QUARTILE.EXC. The basic syntax is:
=QUARTILE(array, quart)
or
=QUARTILE.INC(array, quart)
or
=QUARTILE.EXC(array, quart)
Where:
- array: The range of cells containing your data
- quart: A number from 0 to 4, representing different quartile values
Let’s understand what each quartile number means:
|
Quart Value |
Returns |
|---|---|
|
0 |
Minimum value |
|
1 |
First quartile (Q1) |
|
2 |
Median (Q2) |
|
3 |
Third quartile (Q3) |
|
4 |
Maximum value |
Find First, Second, and Third Quartiles
Let’s walk through calculating each quartile using a sample dataset of monthly sales figures:
Sample Dataset:
Month Sales
Jan $1,000
Feb $1,500
Mar $2,000
Apr $2,500
May $3,000
Jun $3,500
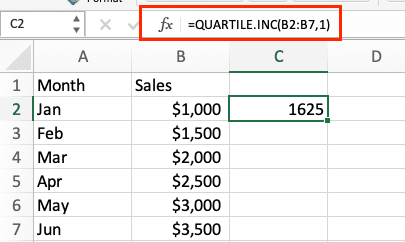
Step 1: Calculate First Quartile (Q1)
=QUARTILE.INC(B2:B7,1)
This returns $1,625, representing the 25th percentile.
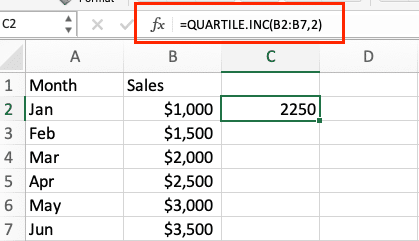
Step 2: Calculate Second Quartile (Q2/Median)
=QUARTILE.INC(B2:B7,2)
This returns $2,250, representing the 50th percentile.
Step 3: Calculate Third Quartile (Q3)
=QUARTILE.INC(B2:B7,3)
This returns $2,875, representing the 75th percentile.

Create a Quartile Summary Dashboard
Let’s create a comprehensive quartile analysis dashboard:
Step 1: Set up your dashboard layout
|
Measure |
Value |
Formula |
|---|---|---|
|
Minimum |
=QUARTILE.INC(data,0) |
Returns $1,000 |
|
Q1 |
=QUARTILE.INC(data,1) |
Returns $1,625 
Try the Free Spreadsheet Extension Over 500,000 Pros Are Raving About
Stop exporting data manually. Sync data from your business systems into Google Sheets or Excel with Coefficient and set it on a refresh schedule. Get Started |
|
Median |
=QUARTILE.INC(data,2) |
Returns $2,250 |
|
Q3 |
=QUARTILE.INC(data,3) |
Returns $2,875 |
|
Maximum |
=QUARTILE.INC(data,4) |
Returns $3,500 |
QUARTILE.INC vs QUARTILE.EXC: Which to Use?
The main difference between these functions lies in how they calculate quartiles:
QUARTILE.INC (Inclusive Method)
- Includes the actual minimum and maximum values
- Better for smaller datasets
- More commonly used in business applications
Example using our sales data:
=QUARTILE.INC(B2:B7,1) returns $1,625
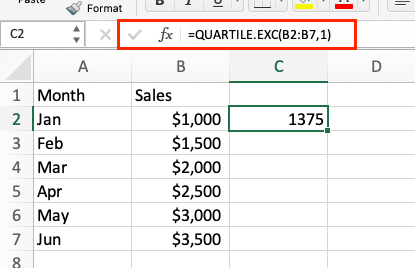
QUARTILE.EXC (Exclusive Method)
- Excludes the minimum and maximum values
- Better for larger datasets
- Preferred in academic/statistical analysis
Example using the same data:
=QUARTILE.EXC(B2:B7,1) returns $1,375
Working with Sales Data Quartiles
Let’s apply quartiles to analyze sales performance:
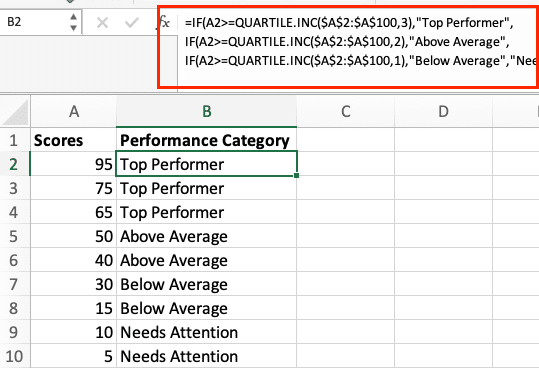
Step 1: Segment customers by revenue
=IF(A2>=QUARTILE.INC($A$2:$A$100,3),”Top Performer”,
IF(A2>=QUARTILE.INC($A$2:$A$100,2),”Above Average”,
IF(A2>=QUARTILE.INC($A$2:$A$100,1),”Below Average”,”Needs Attention”)))
Survey Data Analysis with Quartiles
For survey data analysis, use this approach:
Step 1: Calculate response distribution
=QUARTILE.INC(response_range,1) for lower quartile
=QUARTILE.INC(response_range,2) for median
=QUARTILE.INC(response_range,3) for upper quartile
Interquartile Range Calculation
The Interquartile Range (IQR) helps identify outliers:
=QUARTILE.INC(data,3)-QUARTILE.INC(data,1)

Outlier Identification:
- Lower bound = Q1 – (1.5 × IQR)
- Upper bound = Q3 + (1.5 × IQR)
Next Steps
Now that you understand how to use quartile functions in Excel, you can apply these techniques to your own data analysis projects. To streamline your data analysis process and ensure you’re always working with the most current data, consider using Coefficient. Our add-on allows you to automatically sync live data from your business systems directly into Excel, making your quartile analysis more efficient and accurate.
Get started with Coefficient today to enhance your Excel data analysis capabilities.


