
Enable Power Pivot by accessing the Power Pivot tab in your Excel ribbon
Build a data model that serves as the foundation for your analysis
Create relationships between tables to analyze data across multiple sources
Use DAX (Data Analysis Expressions) to create custom calculations
Build your own data models to unlock deeper insights from your business data
Power Pivot transforms Excel from a basic spreadsheet tool into a robust data analysis platform. This powerful add-in lets you work with millions of rows of data, create complex calculations, and build sophisticated data models that connect multiple data sources. Whether you’re analyzing sales data or tracking business metrics, Power Pivot equips you with the capabilities you need.
Create Your First Power Pivot Data Model
A data model serves as the foundation for your analysis. Let’s walk through the process of building one from scratch.
Step 1: Enable Power Pivot
- Open Excel
- Navigate to File > Options > Add-ins
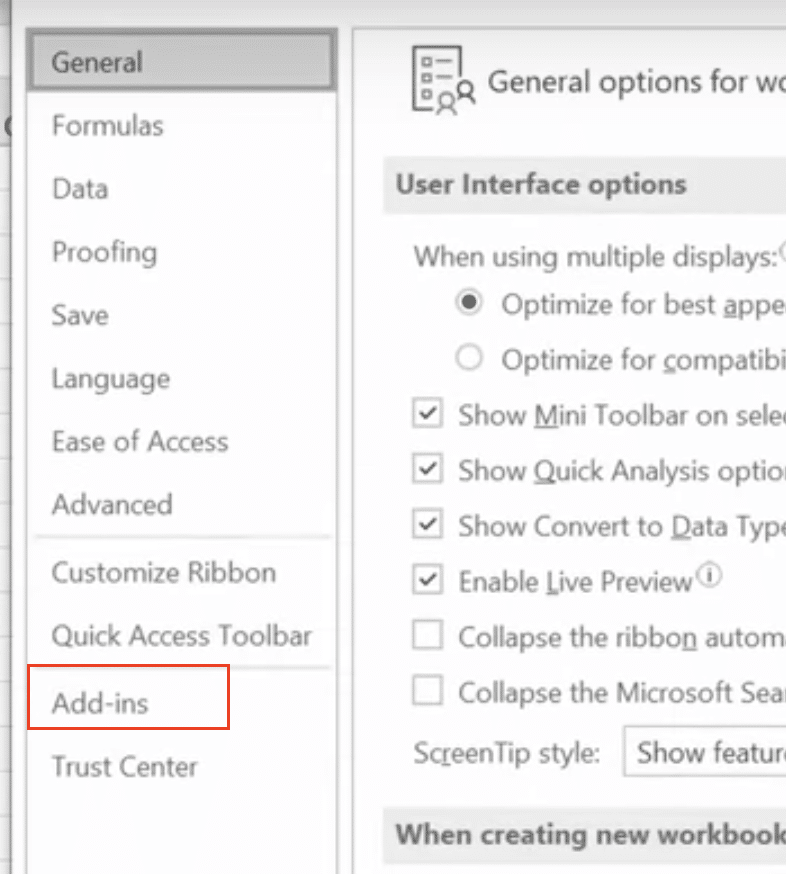
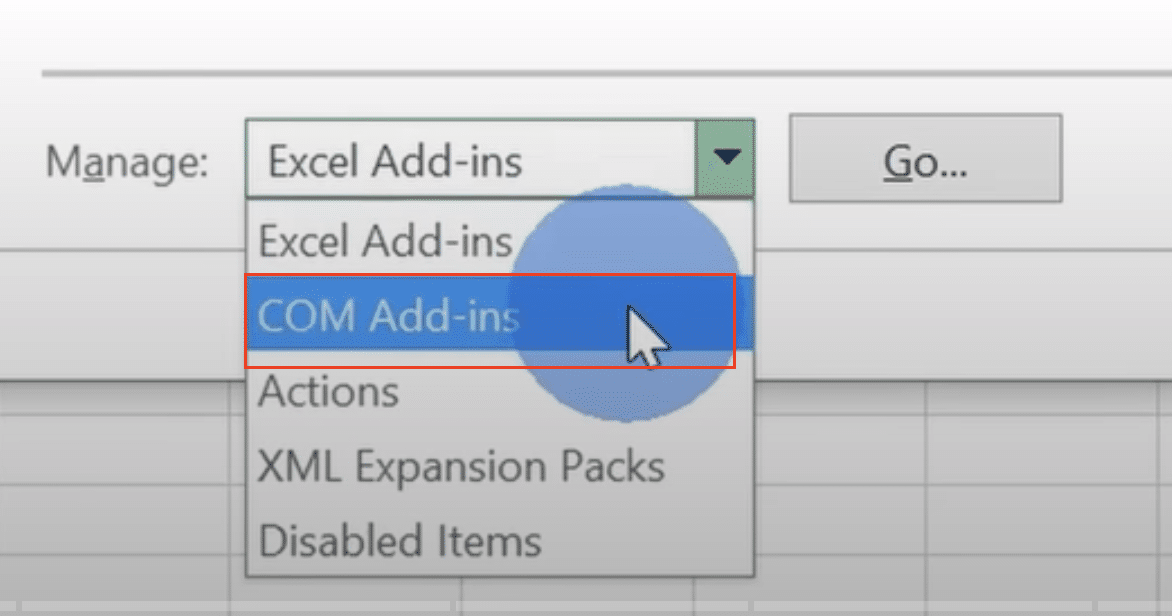
- Select ‘COM Add-ins‘ from the dropdown
- Check the box next to ‘Microsoft Power Pivot’
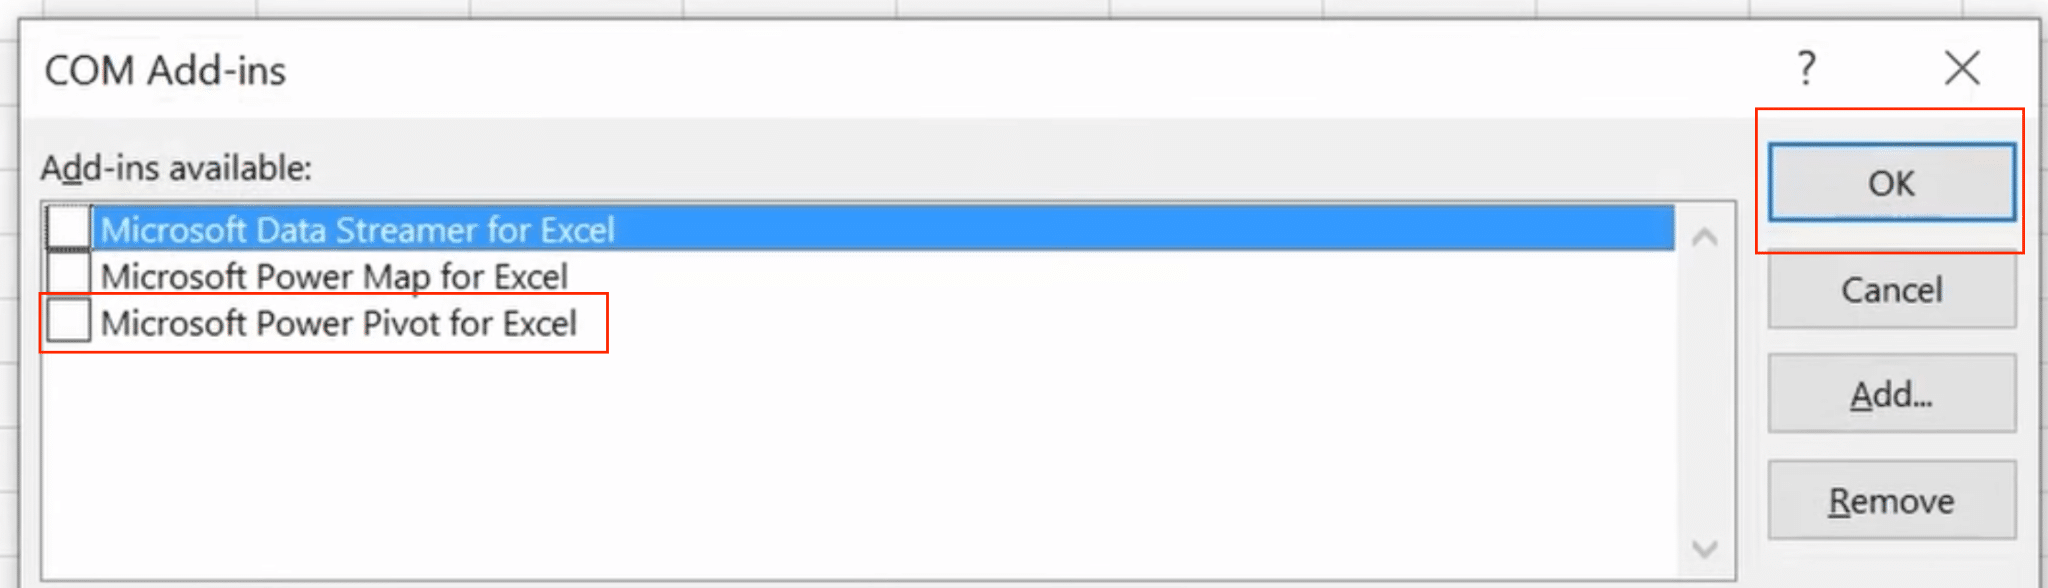
- Click OK
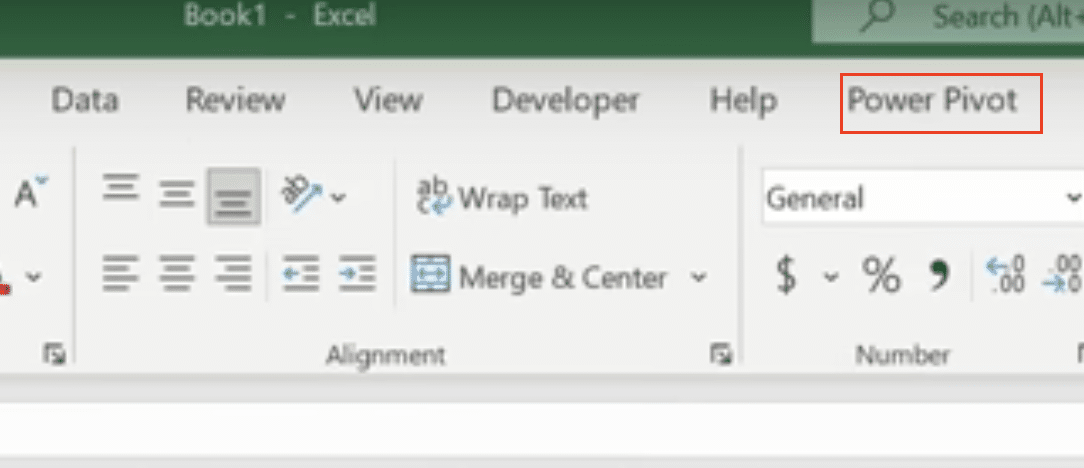
You’ll now see the Power Pivot tab in your Excel ribbon.
Step 2: Import Data
- Click the Power Pivot tab
- Select ‘Manage Data Model‘
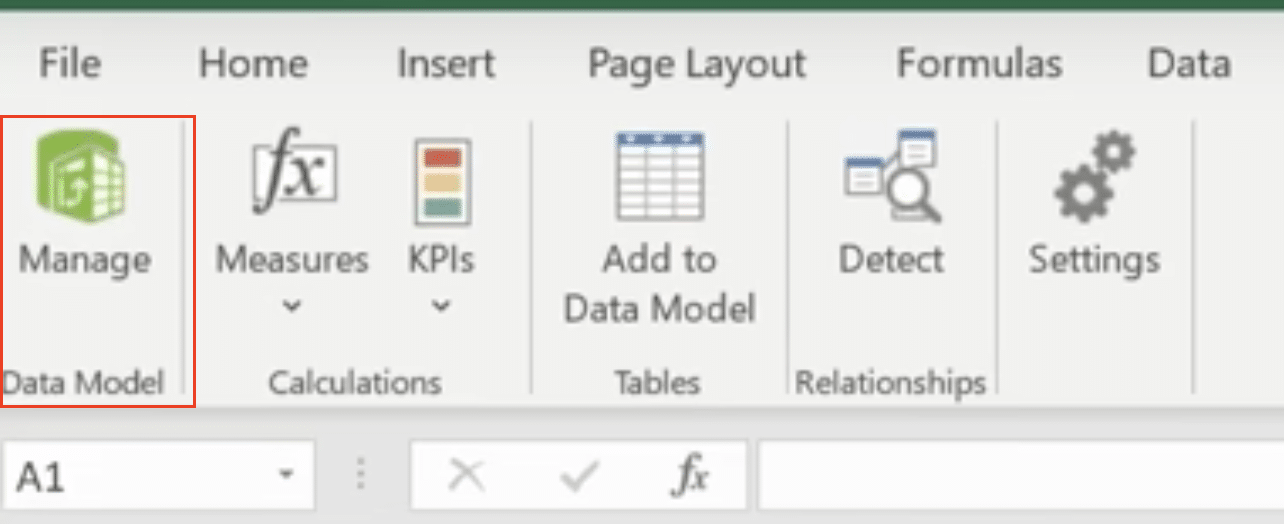
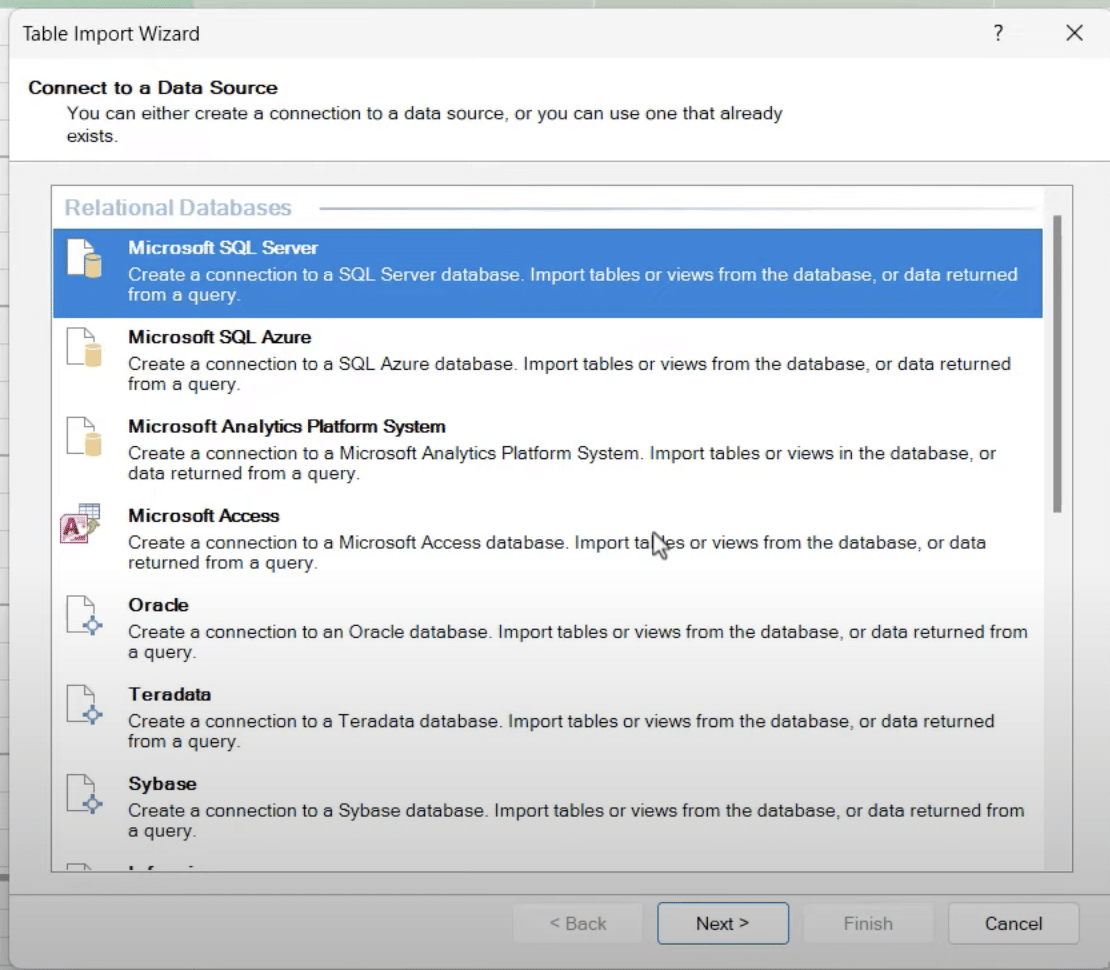
- Choose different data sources from ‘Get External Data‘
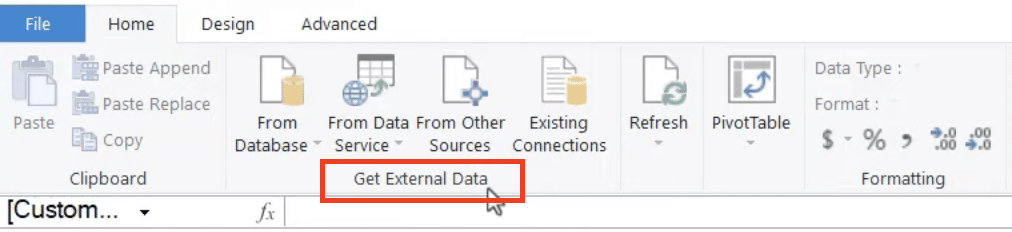
- Select your data source (e.g., SQL Server, CSV, Excel)
Tips for successful data import:
- Review data types before importing
- Remove unnecessary columns to improve performance
- Consider using only required rows for your analysis
Step 3: Set Up Table Relationships
Building relationships between tables allows you to analyze data across multiple sources.
- Click ‘Diagram View‘ in Power Pivot
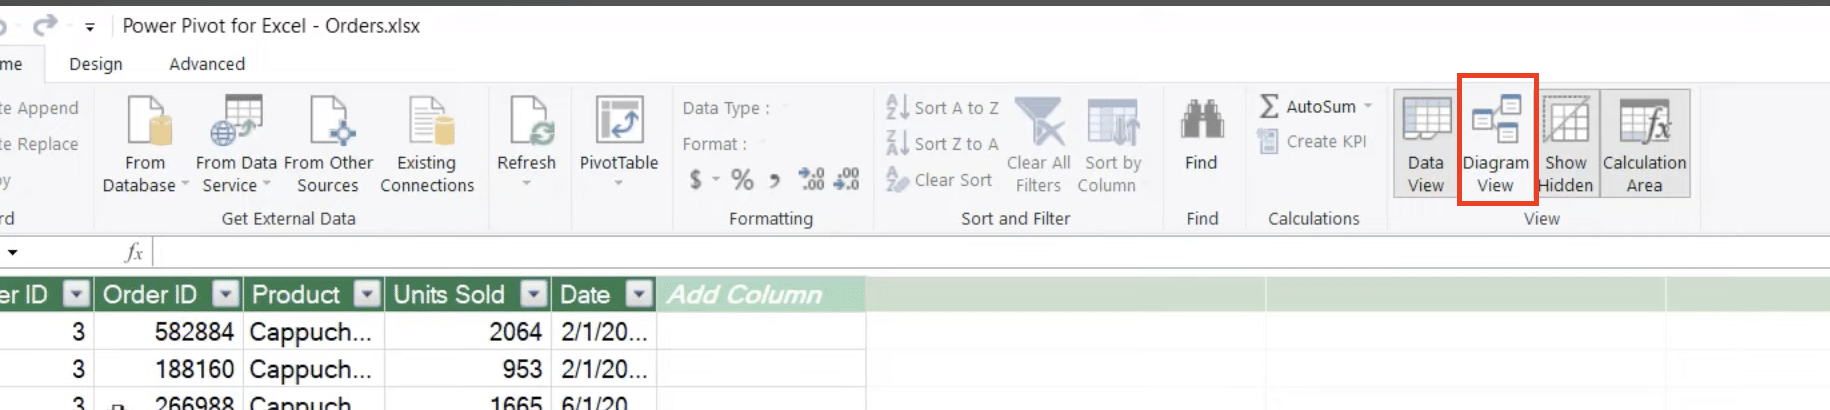
- Drag the primary key from one table to the related foreign key in another
- Verify the relationship type (typically one-to-many)
Example relationship setup:
|
Table 1 (Primary) |
Relationship |
Table 2 (Foreign) |
|---|---|---|
|
OrderID |
→ |
OrderDetails |
|
CustomerID |
→ |
CustomerInfo |
Creating Calculated Columns with DAX
DAX (Data Analysis Expressions) enables you to create custom calculations.
Basic DAX formula structure:
[New Column Name] = CALCULATE([Expression])
Common DAX calculations:
|
Purpose |
Formula Example |
|---|---|
|
Sum |
Total = SUM([Amount]) 
Try the Free Spreadsheet Extension Over 500,000 Pros Are Raving About
Stop exporting data manually. Sync data from your business systems into Google Sheets or Excel with Coefficient and set it on a refresh schedule. Get Started |
|
Average |
Avg Price = AVERAGE([Price]) |
|
YoY Growth |
Growth = ([Current] – [Previous])/[Previous] |
Tips for DAX formulas:
- Start simple and build complexity gradually
- Use clear naming conventions
- Test calculations with small data sets first
Analyze Large Datasets Using Power Pivot
Power Pivot excels at handling large data volumes efficiently.
Create Hierarchies
- Right-click a column in the data model
- Select ‘Create Hierarchy’
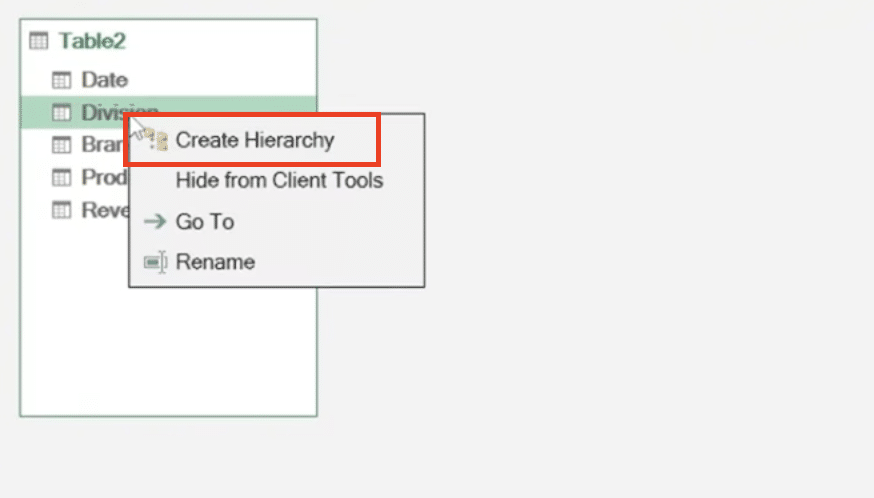
- Add relevant fields in order (e.g., Year > Quarter > Month)
Implement Slicers
- Insert a PivotTable from your data model
- Select fields for analysis
- Add slicers for key filtering fields
- Connect slicers to multiple PivotTables for synchronized filtering
Working with Time-Based Analysis
Time intelligence functions in Power Pivot enable sophisticated date-based calculations.
Example time calculations:
|
Calculation |
DAX Formula |
|---|---|
|
YTD Sales |
TOTALYTD(SUM([Sales]), [Date]) |
|
Previous Month |
CALCULATE(SUM([Sales]), PREVIOUSMONTH([Date])) |
|
Rolling 12M |
CALCULATE(SUM([Sales]), DATESINPERIOD([Date], LASTDATE([Date]), -12, MONTH)) |
Combining Multiple Data Sources
Power Pivot allows seamless integration of various data sources.
Best practices for data integration:
- Maintain consistent key relationships
- Use appropriate data types
- Schedule regular refreshes
- Document data sources and relationships
Next Steps
Now that you understand Power Pivot’s core functionality, start building your own data models to unlock deeper insights from your business data. For even more powerful data analysis capabilities, consider using Coefficient to automatically sync live data from 50+ business systems directly into your spreadsheets.


