Calculating net present value (NPV) is essential for making informed investment decisions and evaluating project profitability. Excel’s NPV function streamlines this complex calculation, helping you determine whether an investment will create value over time. This comprehensive guide shows you how to use Excel’s NPV function effectively, from basic calculations to advanced modeling techniques.
Calculating Net Present Value in Excel
The NPV function in Excel calculates the net present value of an investment using a discount rate and a series of future cash flows. Here’s how to perform a basic NPV calculation:
- Open Excel and create a new worksheet
- Enter your cash flow data in consecutive cells
- Select the cell where you want your NPV result
- Type the NPV formula using this syntax:
=NPV(discount_rate, value1, [value2], …)
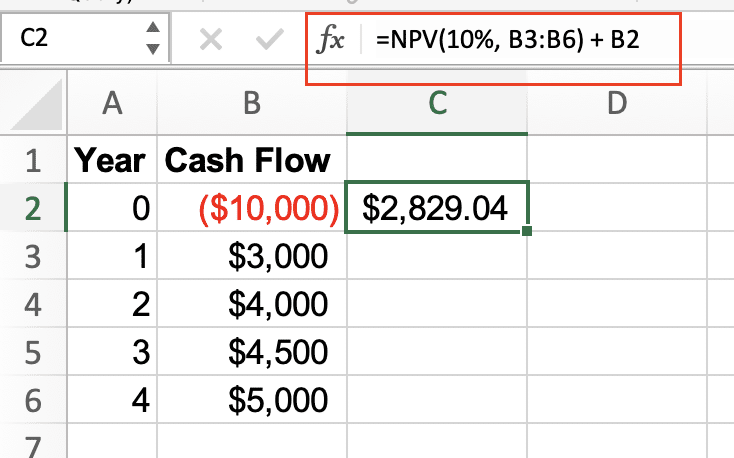
Example: Let’s calculate the NPV of a project with the following parameters:
- Initial investment: $10,000
- Discount rate: 10%
- Cash flows: $3,000, $4,000, $4,500, $5,000 (over 4 years)
|
Year |
Cash Flow |
|---|---|
|
0 |
-$10,000 |
|
1 |
$3,000 |
|
2 |
$4,000 |
|
3 |
$4,500 |
|
4 |
$5,000 |
Formula:
=NPV(10%, B3:B6) + B2
Working with Multiple Cash Flows
When dealing with multiple cash flows, follow these steps:
- Organize your cash flows chronologically
- Include the initial investment separately
- Link all cash flows in the formula
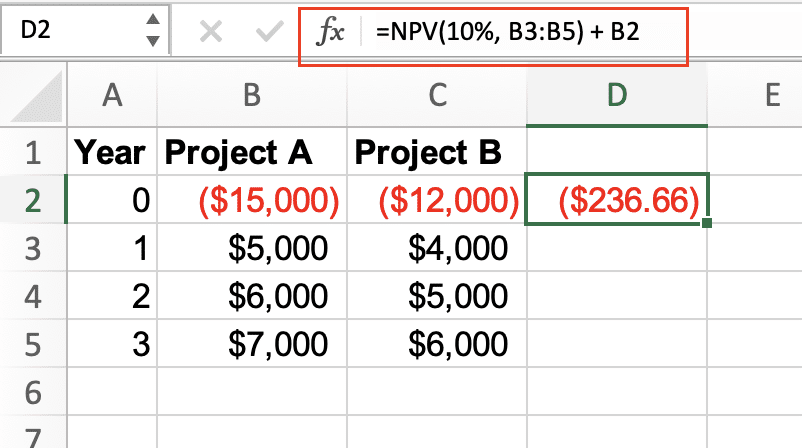
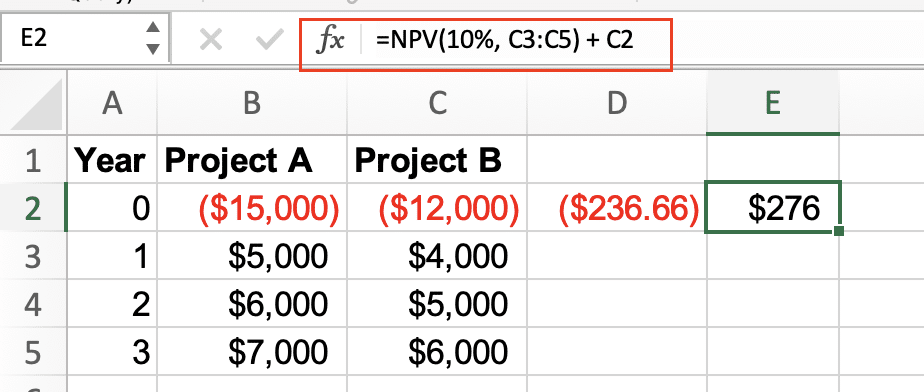
Example with multiple investment streams:
|
Year |
Project A |
Project B |
|---|---|---|
|
0 |
-$15,000 |
-$12,000 |
|
1 |
$5,000 |
$4,000 |
|
2 |
$6,000 |
$5,000 |
|
3 |
$7,000 |
$6,000 |
Formula for comparing projects:
=NPV(10%, B2:B4) + B1
=NPV(10%, C2:C4) + C1
Handling Irregular Payment Periods
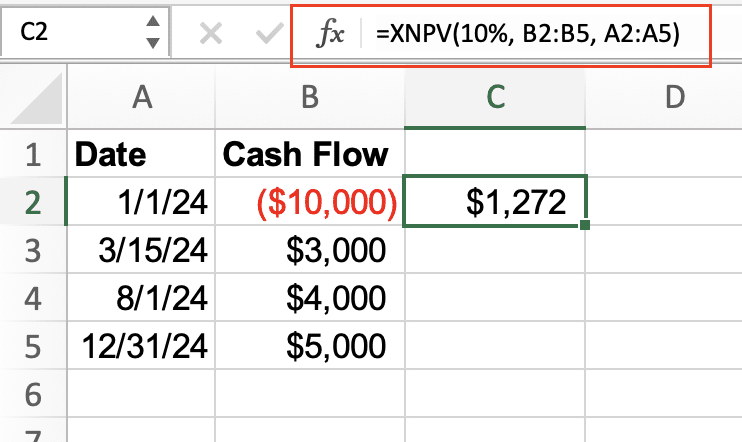
For investments with non-uniform payment dates, use the XNPV function:
=XNPV(rate, values, dates)
Example:
|
Date |
Cash Flow |
|---|---|
|
1/1/2024 |
-$10,000 |
|
3/15/2024 |
$3,000 |
|
8/1/2024 |
$4,000 |
|
12/31/2024 |
$5,000 |
Formula:
=XNPV(10%, B2:B5, A2:A5)
NPV Formula Components
Discount Rate Selection
The discount rate significantly impacts NPV calculations. Consider:
- Risk-free rate (typically government bond yields)
- Risk premium
- Inflation expectations
Example of sensitivity analysis:
|
Discount Rate |
NPV Result |
|---|---|
|
8% 
Try the Free Spreadsheet Extension Over 500,000 Pros Are Raving About
Stop exporting data manually. Sync data from your business systems into Google Sheets or Excel with Coefficient and set it on a refresh schedule. Get Started |
$4,320 |
|
10% |
$3,856 |
|
12% |
$3,425 |
Cash Flow Timing Considerations
Timing assumptions affect NPV accuracy:
- Beginning vs. end of period
- Payment frequency
- Seasonal variations
Building Complex NPV Models
Multiple Investment Streams
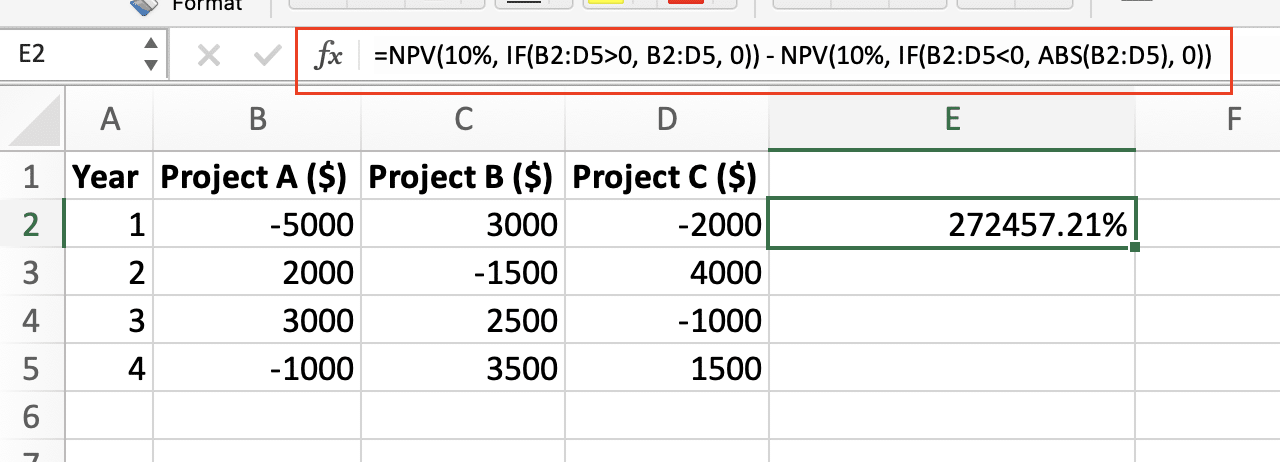
Combine multiple cash flows using array formulas:
=NPV(10%, IF(B2:D5>0, B2:D5, 0)) – NPV(10%, IF(B2:D5<0, ABS(B2:D5), 0))
Variable Discount Rates
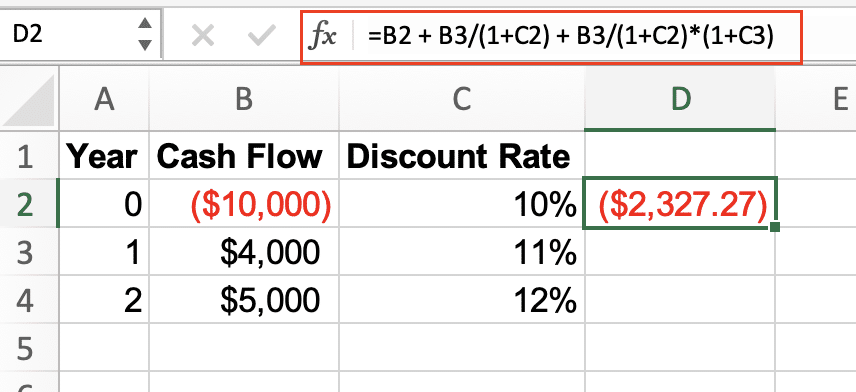
For different discount rates over time:
|
Year |
Cash Flow |
Discount Rate |
|---|---|---|
|
0 |
-$10,000 |
10% |
|
1 |
$4,000 |
11% |
|
2 |
$5,000 |
12% |
Formula:
=B1 + B2/(1+C2) + B3/(1+C2)*(1+C3)
NPV vs Other Financial Functions
XNPV vs NPV Comparison
|
Function |
Use Case |
Example |
|---|---|---|
|
NPV |
Regular intervals |
=NPV(10%, B2:B5) |
|
XNPV |
Irregular dates |
=XNPV(10%, B2:B5, A2:A5) |
IRR Integration
Calculate Internal Rate of Return alongside NPV:
=IRR(B1:B5)
Next Steps
Apply these NPV calculations to evaluate your investment opportunities and financial projects. Start with simple scenarios and gradually incorporate more complex elements as you become comfortable with the functions.
Ready to automate your financial analysis and connect live data to your NPV calculations? Get started with Coefficient to streamline your financial modeling workflow and ensure your NPV calculations always use the most current data.
