Need to calculate probabilities in Excel? You’ve come to the right place! This guide shows you how to use Excel’s built-in functions to find different types of probabilities. You’ll learn practical methods for working with probability distributions and statistical data. Let’s dive in!
Probability in Excel 101: The Basics
Probability measures the likelihood that an event will occur.
For example, if you roll a six-sided die, the probability of rolling a 4 is 1/6, as there is one favorable outcome (rolling a 4) out of a total of six possible outcomes (1, 2, 3, 4, 5, 6).
In Excel, you can perform simple probability calculations using basic functions and formulas. Let’s say you want to calculate the probability of rolling a 3 or a 5 on a six-sided die. You can use the following formula:
=PROB(3,5,6)
This formula calculates the probability of the events 3 and 5 occurring out of a total of 6 possible outcomes, which is 2/6 or 1/3.
Using the PROB Function in Excel
One of the most versatile functions for calculating probability in Excel is the PROB function. The PROB function allows you to calculate the probability of a range of values occurring within a dataset.
The syntax for the PROB function is as follows:
=PROB(known_x’s, known_prob’s, [x])
- known_x’s: The range of values for which you want to calculate the probability.
- known_prob’s: The corresponding probabilities for the values in the known_x’s range.
- [x] (optional): The value for which you want to calculate the probability.
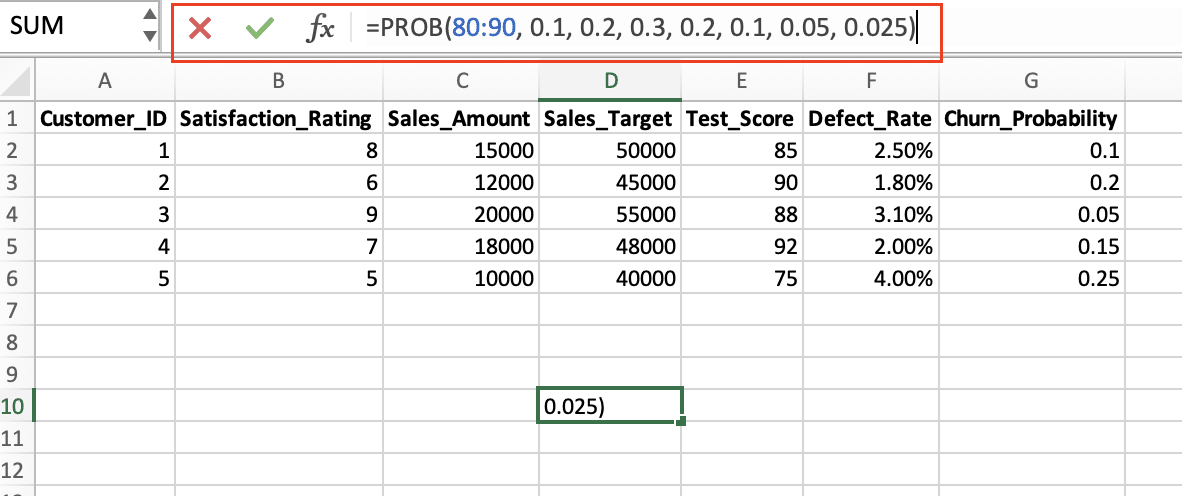
Let’s say you have a dataset of exam scores and you want to calculate the probability of a student scoring between 80 and 90.

You can use the PROB function like this:
=PROB(80:90, 0.1, 0.2, 0.3, 0.2, 0.1, 0.05, 0.025)
In this example, the known_x’s range is 80 to 90, and the known_prob’s are the corresponding probabilities for each score range. The function will return the probability of a student scoring between 80 and 90.

Calculating Normal Distribution in Excel
Another important concept in probability is the normal distribution, which is a bell-shaped curve that represents the distribution of many natural and social phenomena. Excel provides the NORM.DIST function to help you calculate probabilities related to normal distribution.
The syntax for the NORM.DIST function is as follows:
=NORM.DIST(x, mean, standard_dev, cumulative)
- x: The value for which you want to calculate the probability.
- mean: The mean or average of the dataset.
- standard_dev: The standard deviation of the dataset.
- cumulative: A logical value that determines whether to return the cumulative distribution function (TRUE) or the probability density function (FALSE).
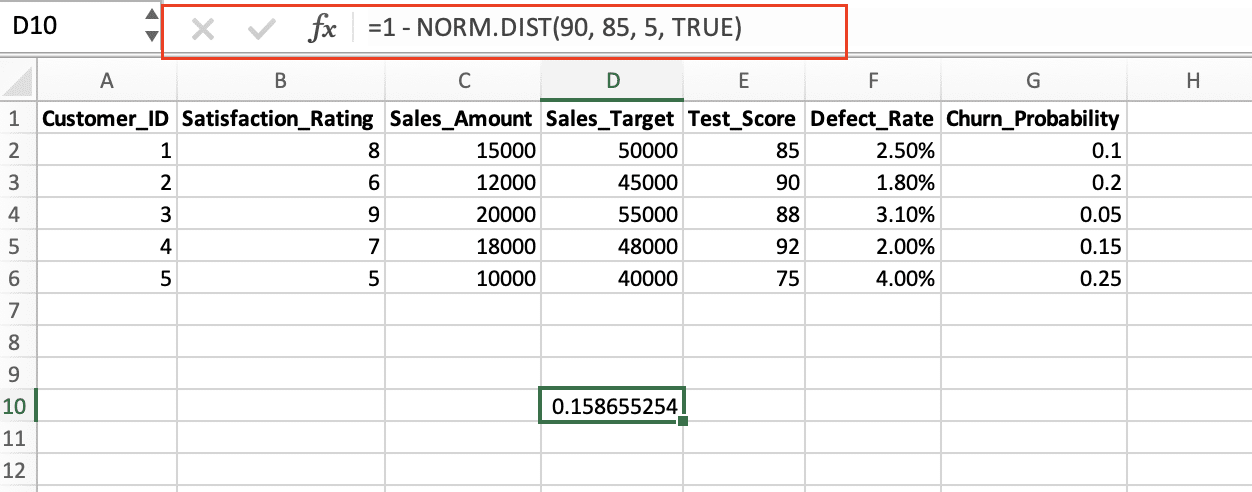
Let’s say you have a dataset of test scores with a mean of 85 and a standard deviation of 5. You want to calculate the probability of a student scoring 90 or higher. You can use the NORM.DIST function like this:
=1 – NORM.DIST(90, 85, 5, TRUE)
This formula calculates the cumulative probability of a student scoring 90 or higher, which is 1 – the probability of scoring less than 90.

By mastering these basic probability functions in Excel, you’ll be well on your way to unlocking the power of data analysis and making informed decisions based on the insights you uncover.
Using T.TEST for Probability Calculations
The T.TEST function in Excel is a powerful tool for calculating the probability of a given value or range of values. This function is particularly useful when you need to determine the likelihood of a specific outcome based on a sample data set.
To use the T.TEST function, simply provide the following arguments:
- The first data set or range of values
- The second data set or range of values (if applicable)
- The tailed distribution (1 for one-tailed, 2 for two-tailed)
- The type of T-test (1 for paired, 2 for two-sample unequal variance, 3 for two-sample equal variance)
For example, let’s say you want to calculate the probability that the average test scores of two different study groups are the same. You can use the T.TEST function to determine the likelihood of this hypothesis:
Copy code

Stop exporting data manually. Sync data from your business systems into Google Sheets or Excel with Coefficient and set it on a refresh schedule.
Get Started
=T.TEST(Group1_Scores, Group2_Scores, 2, 2)
This formula will return the probability (p-value) that the average test scores of the two groups are not significantly different. By understanding the T.TEST function and its various arguments, you can perform advanced probability calculations in Excel to support your decision-making processes.

Advanced Probability Calculations: Z-Scores and More
In addition to the T.TEST function, Excel provides other tools for calculating more complex probability distributions. One such tool is the z-score, which is a standardized measure of how many standard deviations a data point is from the mean.
To calculate a z-score in Excel, you can use the following formula:
Copy code
=(Value – Mean) / Standard_Deviation
Once you have the z-score, you can use it to determine the probability of a specific value or range of values occurring within a normal distribution. This can be particularly useful when analyzing data that follows a bell-shaped curve, such as test scores, product defects, or customer satisfaction ratings.
For example, let’s say you want to calculate the probability that a customer’s satisfaction rating falls within a certain range. You can use the z-score to determine the likelihood of this occurrence:
- Calculate the z-score for the lower and upper bounds of the desired range.
- Use the NORM.DIST function in Excel to find the probability associated with each z-score.
- Subtract the probabilities to get the overall probability of the rating falling within the specified range.
By mastering the use of z-scores and other advanced probability calculations in Excel, you can gain deeper insights into your data and make more informed decisions.
Probability Distributions in Excel: A Deep Dive
Excel also provides a range of functions for working with different probability distributions, such as the normal, binomial, and Poisson distributions. These functions allow you to calculate the probability of specific outcomes or events occurring within a given distribution.
For example, the NORM.DIST function can be used to calculate the probability of a value falling within a normal distribution, while the BINOM.DIST function can be used to calculate the probability of a certain number of successes in a series of independent Bernoulli trials.
To explore these probability distributions in Excel, you can start by understanding the key parameters and assumptions for each distribution. Then, practice applying the relevant functions with sample data to see how they can be used to answer different probability-related questions.
Mastering Probability in Excel for Informed Decision-Making
We’ve covered advanced Excel techniques for calculating probability. From T.TEST to z-scores and probability distributions, you now have the tools to tackle complex probability challenges.
Mastering probability in Excel isn’t just about numbers. It’s about using data to make smart decisions. These techniques will help you:
- Spot risks early
- Uncover hidden opportunities
- Fine-tune your strategies
Want to push your Excel skills further? Coefficient can help. Try it for free today to connect real-time data to your Excel sheets and keep your probability analyses up-to-date.


