Excel tables transform raw data into organized, interactive datasets that make analysis and reporting easier. Whether you’re managing inventory, tracking sales, or analyzing customer data, understanding how to create and manipulate tables in Excel is essential for efficient data management.
Create Your First Excel Table
Let’s start with the fundamental steps to create a basic Excel table.
- Prepare Your Data
- Open Excel and enter your data with clear column headers
- Ensure no blank rows or columns within your dataset
- Verify each column contains consistent data types
- Convert Data to Table
- Select any cell within your data range
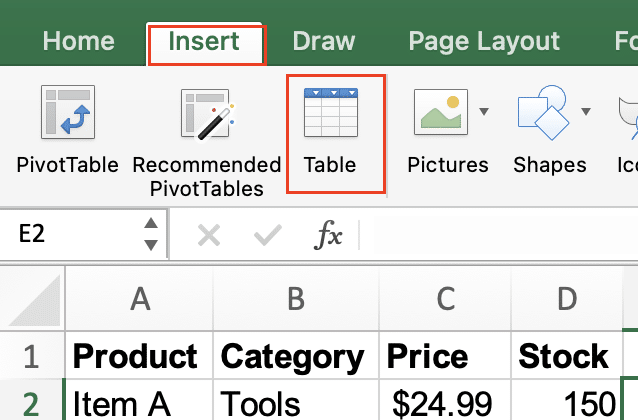
- Press Ctrl + T or navigate to Insert > Table
-
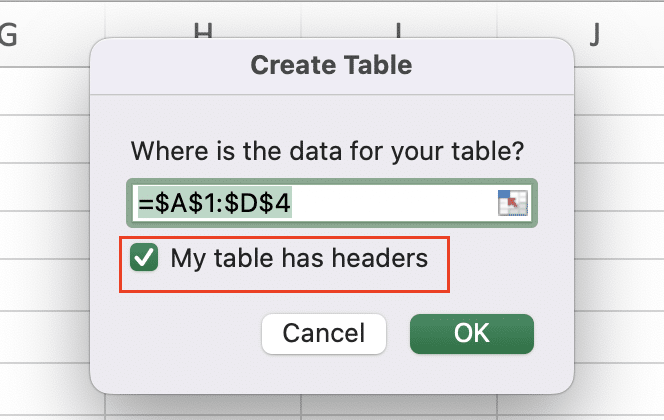
- Check “My table has headers” if your data includes column names
-
- Click OK to confirm
Example Table Structure:
|
Product |
Category |
Price |
Stock |
|---|---|---|---|
|
Item A |
Tools |
$24.99 |
150 |
|
Item B |
Office |
$12.50 |
200 |
|
Item C |
Tools |
$34.99 |
75 |
Format and Customize Your Excel Table
Apply Table Styles and Colors
- Choose a Built-in Style
- Select your table
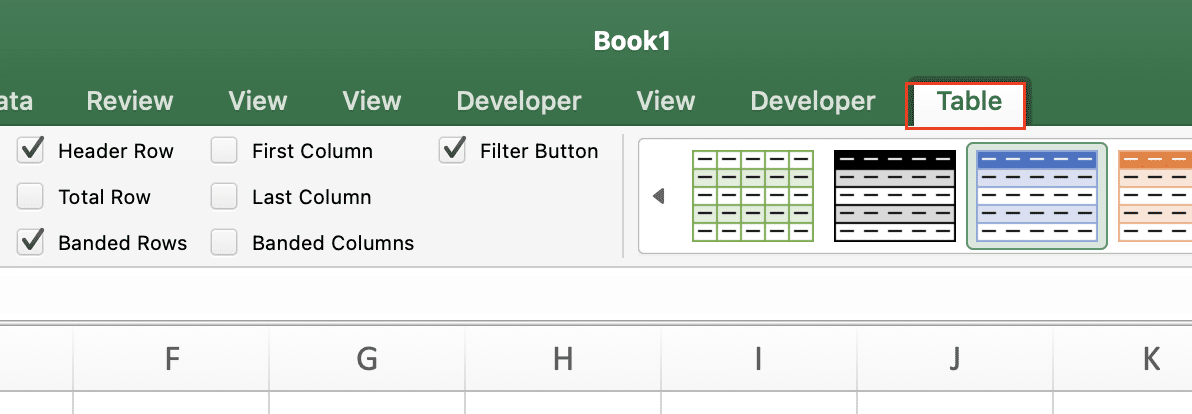
- Navigate to Table Design tab
-
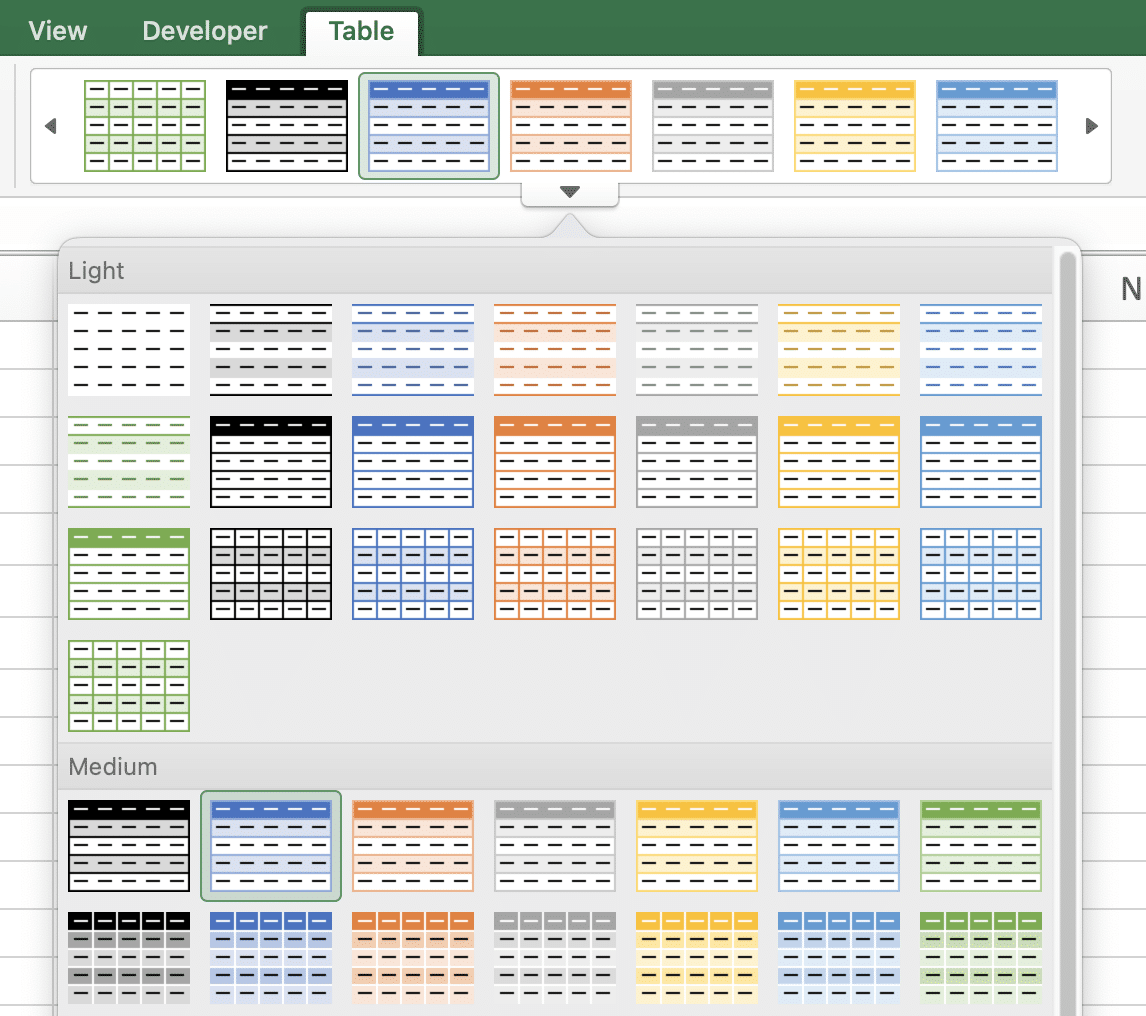
- Click through the gallery of table styles
-
- Hover over options to preview changes
- Customize Table Elements
- Select Table Design > Table Style Options
-
- Toggle features like:
- Header Row
- Total Row
- First/Last Column
- Banded Rows
- Toggle features like:
Add Columns and Rows
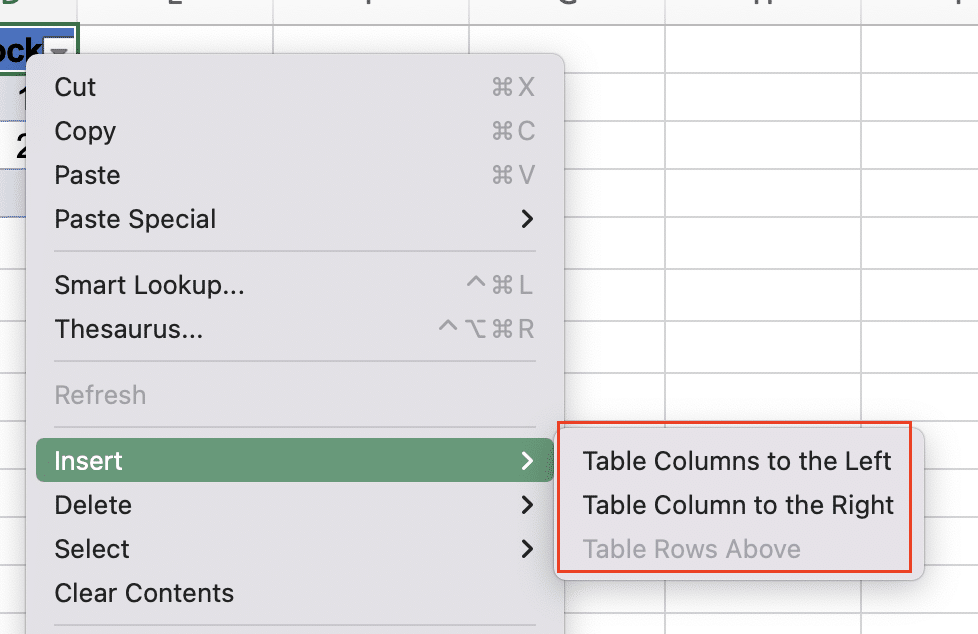
- Insert New Columns
- Right-click on existing column header
- Select Insert > Table Columns to Left/Right

Stop exporting data manually. Sync data from your business systems into Google Sheets or Excel with Coefficient and set it on a refresh schedule.
Get Started
-
- Type header name for the new column
- Add Rows
- Click the last cell in your table
- Press Tab to create a new row
- Enter data in the new row
Work with Table Data
Sort and Filter Table Contents
- Basic Filtering
- Click filter arrow in column header
- Select specific values to display
- Use Search box for large datasets
- Multiple Column Sort
- Click Home > Sort & Filter > Custom Sort

-
- Add sorting levels:

|
Sort Level |
Column |
Order |
|---|---|---|
|
1 |
Category |
A to Z |
|
2 |
Price |
Largest to Smallest |
Create Custom Table Formats
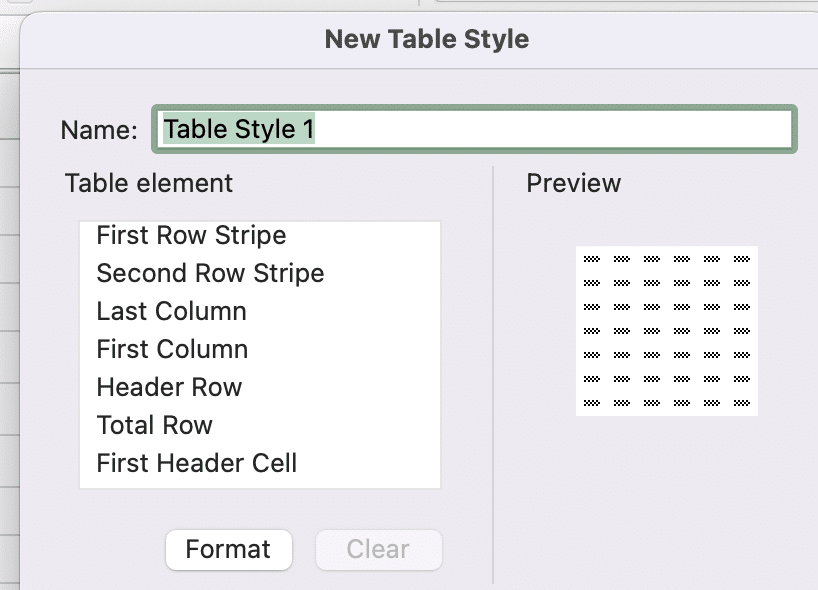
- Design Custom Style
- Table Design > New Table Style
- Modify:
- Header row font and background
- Data row alternating colors
- Border styles and weights
- Save Custom Format
- Name your custom style
- Select Set as default for new tables
- Apply to current table
Build Advanced Table Features
Add Calculated Columns
- Create Formula Column
- Enter formula in first row of new column
- Excel auto-fills formula for entire column
- Use structured references:
Example Formula:
=[@Price] * [@Stock]
Convert Tables to Ranges
- Table to Range Conversion
- Table Design > Convert to Range
- Choose to maintain formatting
- Preserve or remove formulas
Next Steps
Excel tables provide a foundation for efficient data management and analysis. Start with basic tables and gradually incorporate advanced features as you become comfortable with the functionality.
Ready to take your Excel data management to the next level? Connect your spreadsheets to live data sources with Coefficient. Get started now to automate your reporting and ensure real-time data accuracy.

