
Gather the necessary data: Collect the starting and ending values for the time period you want to analyze
Apply the basic growth rate formula: Growth Rate = (Ending Value – Starting Value) / Starting Value
For compound annual growth rate (CAGR), use: CAGR = (Ending Value / Starting Value)^(1/n) – 1
where n is the number of years
Use Excel’s built-in GROWTH function for estimating future values based on historical data
Interpret the results: The CAGR represents the annualized growth rate over the specified time period
Calculating growth rates is crucial for understanding your business’s performance, but it can be challenging without the right tools and knowledge.
In this guide, you’ll learn:
- How to calculate growth rates in Excel
- Using Excel’s GROWTH function for trend analysis
- Common mistakes to avoid when analyzing growth
We’ll also share free calculators to get you started!
Growth Rate Calculation Basics in Excel
The growth rate is a measure of the change in a value over time, expressed as a percentage. To calculate the growth rate in Excel, you can use the following formula:
Growth Rate = (Ending Value – Starting Value) / Starting Value
For example, let’s say your business had a revenue of $100,000 in the previous year and $120,000 in the current year. To calculate the growth rate, you would use the formula:
Growth Rate = ($120,000 – $100,000) / $100,000 = 0.20 or 20%
This means your business experienced a 20% growth in revenue from the previous year to the current year.
Using the GROWTH Function in Excel
In addition to manually calculating the growth rate, Excel also provides a built-in function called GROWTH that can be used to estimate future values based on historical data. The GROWTH function takes the following arguments:
- Known_y’s: The set of y-values you already know.
- Known_x’s: The set of x-values you already know.
- New_x’s: The new x-values for which you want to predict the y-values.
- Const: A logical value that determines whether to force the constant b to be 0.
To use the GROWTH function, follow these steps:
- Arrange your data in a table, with the x-values (e.g., time periods) in one column and the y-values (e.g., revenue) in another column.
- In a new cell, type the formula: =GROWTH(known_y’s, known_x’s, new_x’s, [const]).
- Replace the arguments with the appropriate cell references or ranges from your data.
For example, let’s say you have the following revenue data for the past 4 years:
| Year | Revenue |
| 1 | 100,000 |
| 2 | 120,000 |
| 3 | 135,000 |
| 4 | 150,000 |
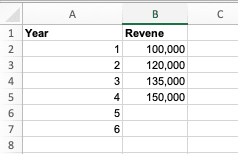
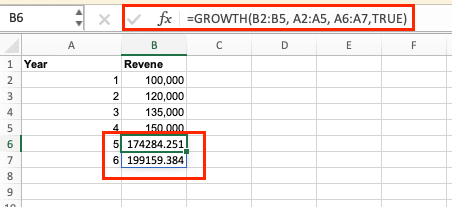
To use the GROWTH function to predict the revenue for the next 2 years, you would enter the following formula:
=GROWTH(B2:B5, A2:A5, A6:A7,True)
This formula will return the predicted revenue values for years 5 and 6 based on the historical data in the “Revenue” column.
By understanding the basics of growth rate calculation, average growth rate, and the GROWTH function in Excel, you’ll be better equipped to track and analyze you
Calculating Compound Annual Growth Rate (CAGR) in Excel
Compound Annual Growth Rate (CAGR) is a powerful metric that measures the annualized growth rate of a value over a specific period. Unlike simple growth rate, CAGR takes into account the compounding effect, providing a more accurate representation of the overall growth trend.
To calculate CAGR in Excel, follow these steps:
- Gather the necessary data: Collect the starting and ending values for the time period you want to analyze.
- Determine the number of years: Calculate the number of years between the starting and ending values.
- Apply the CAGR formula: Use the following formula to calculate the CAGR: CAGR = (Ending Value / Starting Value)^(1/n) – 1 Where:
- Ending Value = The final value in the time period
- Starting Value = The initial value in the time period
- n = The number of years between the starting and ending values
- Interpret the CAGR: The CAGR represents the annualized growth rate over the specified time period. For example, a CAGR of 10% means the value grew by an average of 10% per year.
Here’s an example of calculating CAGR in Excel:

Stop exporting data manually. Sync data from your business systems into Google Sheets or Excel with Coefficient and set it on a refresh schedule.
Get Started
- Let’s say the starting value is $100,000, and the ending value is $150,000 over a 5-year period.
- The number of years is 5.
- Plugging the values into the CAGR formula: CAGR = (150,000 / 100,000)^(1/5) – 1 CAGR = 1.0819 – 1 = 0.0819 or 8.19%
This means the value grew at an annualized rate of 8.19% over the 5-year period.
By understanding and calculating CAGR, you can gain valuable insights into the long-term growth trends of your business, investments, or any other metric you’re tracking.
Free Growth Rate Calculators
To simplify your growth rate calculations, Coefficient offers a suite of free, user-friendly calculators.
Customer Growth Rate Calculator
Calculate the percentage increase or decrease in your customer base over time.
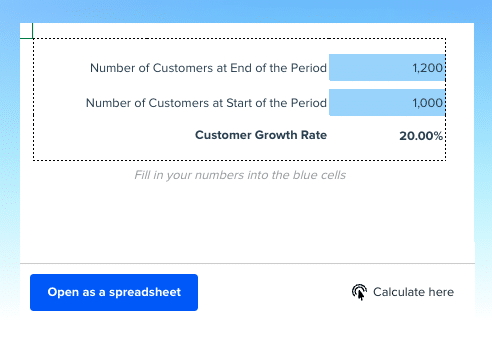
Try it now: Calculate Customer Growth Rate
MRR Growth Rate Calculator
Measure the growth of your Monthly Recurring Revenue to gauge your SaaS company’s health.
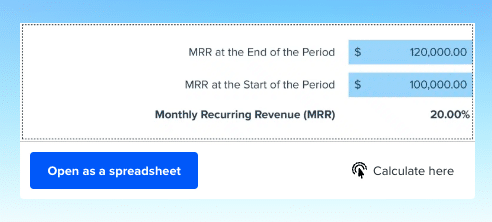
Try it now: Calculate MRR Growth Rate
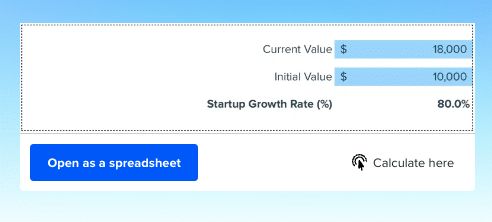
Startup Growth Rate Calculator
Compute your startup’s growth rate by tracking key metrics like revenue or user base.
Try it now: Calculate Startup Growth Rate
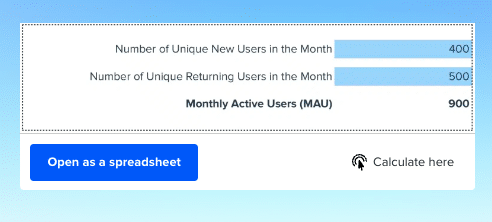
Month Over Month Growth Calculator
Analyze short-term trends by calculating the growth of your KPIs from one month to the next.
Try it now: Calculate Month Over Month Growth
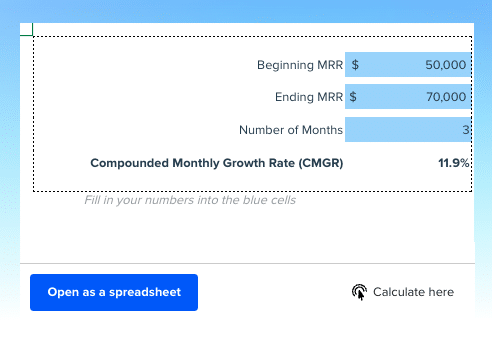
CMGR (Compound Monthly Growth Rate) Calculator
Measure your business’s compound monthly growth rate to understand its growth momentum.
Try it now: Calculate CMGR
Beyond Growth Rates: Real-Time Financial Analysis
Excel offers formulas for calculating growth rates, essential for financial analysis and forecasting. However, keeping these calculations current with the latest data can be challenging. Coefficient connects your Excel sheets directly to financial data sources. This allows you to automatically update your growth rate inputs, perform real-time financial analysis, and generate up-to-date reports without manual data entry. To see how this can streamline your financial calculations, explore Coefficient.

