A cash flow forecast is an essential financial planning tool for businesses to evaluate their total cash position and plan for future capital investments. While there are many software options available, creating a cash flow forecast in Excel remains one of the most popular and flexible approaches, especially for small business owners and financial analysts.
This step-by-step tutorial will guide you through the process of building an effective cash flow forecasting model.
Let’s dive in!
Step-by-Step Guide: Cash Flow Forecast in Excel
In order to produce a cash flow forecast in Microsoft Excel, you must first have a dataset with all of the relevant attributes that go into the report. These typically include:
- Receivables – This identifies sales with customers that you have invoiced and are anticipating payment for.
- Payroll – This represents the cash outflow you have for employees to run your business.
- Payables – This represents outstanding invoices for work that has been done by your vendors that you haven’t paid.
- Forecasted Profit & Loss Statement – Depending how long out into the future you plan on forecasting cash, you will need your forecasted profit & loss statement to estimate what your future cash inflows and outflows will be.
Step 1: Set Up Your Environment
To start your cash flow projection in Microsoft Excel, gather all relevant financial data. Most accounting systems can export historical information for receivables, payroll, payables, and other metrics needed for accurate forecasting.
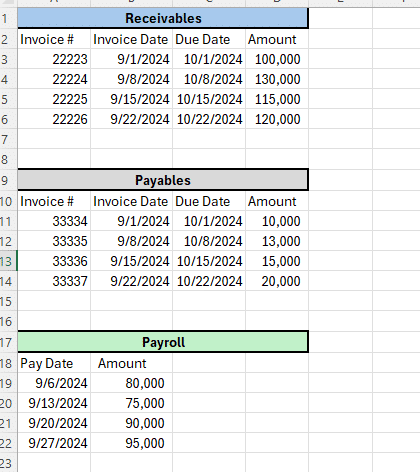
Step 2: Create a Separate Cash Flow Forecast Tab
On a separate tab within Excel create a cash flow forecast template to input relevant data. The structure may vary based on:
- Stakeholder preferences
- Business type
- Forecast period (monthly basis vs weekly)
- Short-term vs long-term planning needs
Also, depending on the needs of your business you may be asked to do cash flow projection on a daily, weekly, or monthly basis. In this example we will be forecasting cash flow on a weekly basis.

Step 3: Input Anticipated Cash Inflow and Cash Outflow
After you’ve created your cash flow forecast template you can use that template to input your anticipated payments and other cash inflows you expect to receive and payment, payroll, and other cash outflows you anticipate having.
In this example we are forecasting cash on a weekly basis, and can use the environment set-up in step 1 to estimate our cash flow.
Input your payments received from vendors based on the invoice due date from your receivables data. In this example you would link the payment for invoice 22223 in week ending 10/5/2024, invoice 22224 in week ending 10/8/2024, etc.
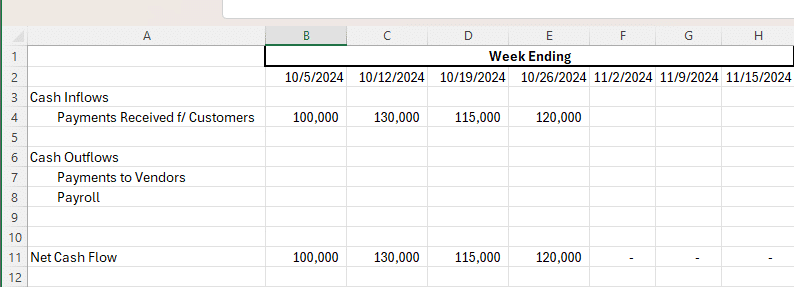
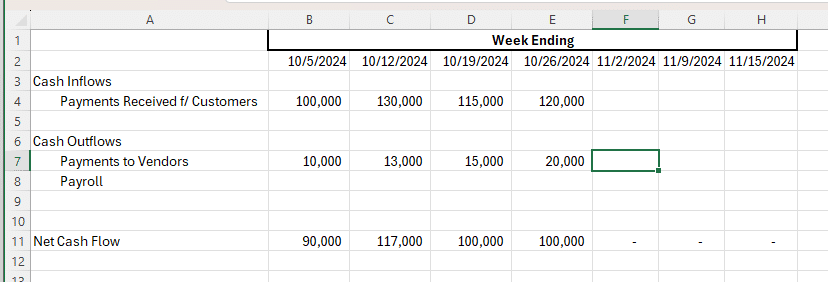
Input your payment to vendors based on the invoice due date from your payables data. In order to maximize cash flow, you typically won’t want to pay invoices prior to the due date.
In this example you would link the payment for invoice 33334 in week ending 10/5/2024, invoice 33335 in week ending 10/12/2024, etc.
Step 4: Estimate Future Cash Flow
After you’ve input your known receipts and payments of cash into your cash forecast, you will want to use that information to forecast cash in future weeks that don’t have known inputs.
In this example you can set-up a excel formula to calculate the average payments received from customers in order to estimate future customer payments.
Use this average formula =AVERAGE ($B4:$E4)
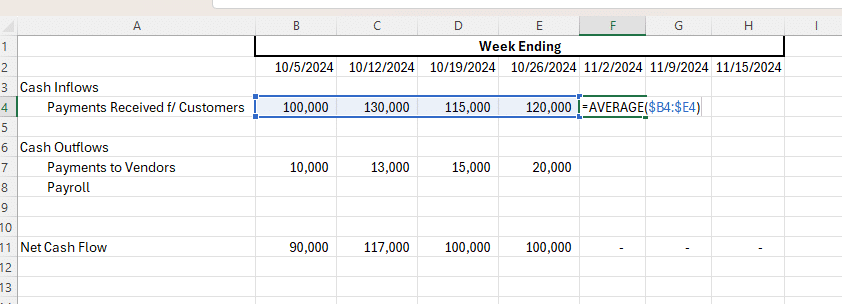
Next, you can do the same calculation for your payments to vendors.
Use this average formula =AVERAGE ($B7:$E7)

Lastly, you will want to estimate your payroll. In this scenario we will want to use the average payroll from the data you set-up in your environment in step 1.
Use this average formula from the environment/data tab =AVERAGE ($B19:$B22)
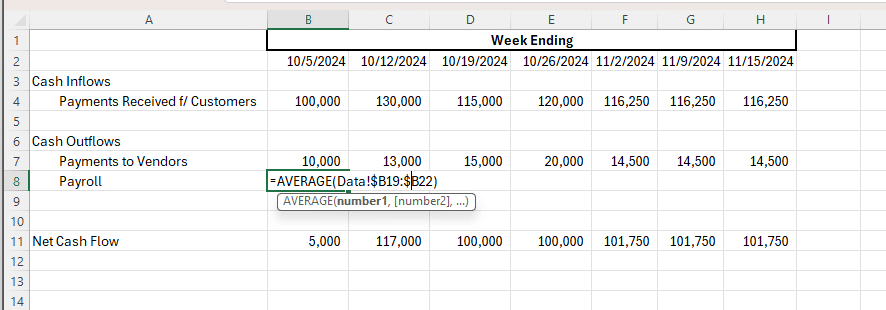
Once you’ve estimated your average payroll you will be able to estimate your net cash flow each week. In this example we are anticipating a $5,000 net cash flow in week ending 10/5/2024, $32,000 net cash flow in week ending 10/12/2024, and so on.

Stop exporting data manually. Sync data from your business systems into Google Sheets or Excel with Coefficient and set it on a refresh schedule.
Get Started

Using the prior period data and averaging it to estimate your future cash inflow and outflow is only one method of estimating receipts and payments to forecast cash flow. This is ideally used when your business is fairly consistent week-to-week and there aren’t significant spikes or seasonality.
You can also use your forecasted profit and loss statement to help build your cash flow forecast. This is ideal and applicable when:
- You have a robust and accurate forecasting process at your organization you can use that forecast to estimate your future cash flow.
- You can input specific sales data from customers, payments to vendors, and anticipated payroll rather than using an average.
- Your business fluctuates significantly whether it be flash sales, seasonality, or other dependent factors causing the fluctuations.
Step 5: Assess Future Cash Balance
After you have estimated your cash flow for the future weeks, months, and/or years you can add your current cash balance to your forecast in order to see your forecasted cash balance at each point in time.
In order to calculate the future cash balance in your analysis you will need to add your current cash on hand to your cash flow forecast. In this example our current cash on hand is $200,000.
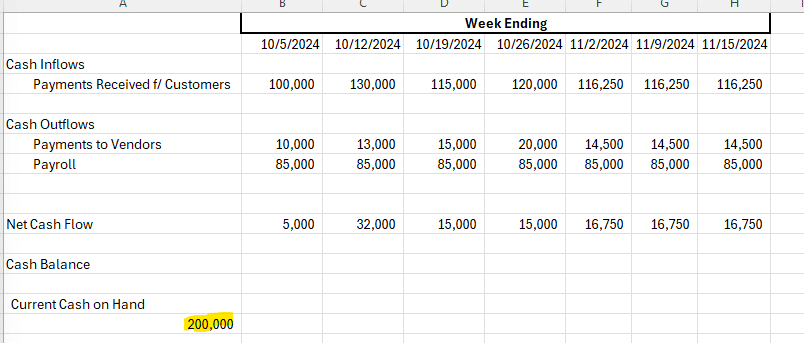
Once the current cash on hand has been added to your forecast you can add the net cash flow each week and create a forecasted cash balance at each point in time. To do this you will need to create a formula in the cash balance row that was added, outlined below.
Cash Balance Formula = Prior Period Cash Balance + Current Period Net Cash Flow
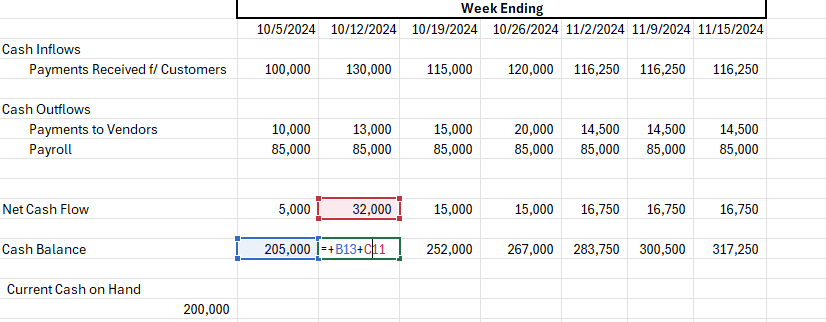
Once the cash balance has been added to your cash flow forecast you are able to analyze and make decisions on what to do with that cash balance as well as any future financing needs your organization may have.
Use Cases for Building a Cash Flow Forecast
A comprehensive cash flow forecast helps organizations:
- Assess financial viability and avoid potential shortfalls
- Plan for debt financing needs with real-time accuracy
- Schedule shareholder distributions effectively
- Optimize working capital management
- Make informed decisions about capital expenditures
- Negotiate better payment terms with customers and vendors
Improve Your Cash Flow Forecasting in Excel
Cash flow forecasts are critical for effective financial planning and data analysis. Whether you’re managing a small business or handling complex financial modeling, accurate forecasting helps drive better business decisions.
Ready to take your financial planning to the next level? Try Coefficient to seamlessly integrate your Excel with live data from various business systems, enabling real-time data analysis and advanced financial modeling.
Try Coefficient to seamlessly integrate your Excel with live data from various business systems, enabling real-time break-even analysis and more advanced financial modeling.

