It can be challenging to stay on top of complex projects, but with the right tools, you can keep your projects on track. Gantt charts are a common solution.
This guide explains how to create and use Gantt charts in Excel. You’ll find step-by-step instructions and free Gantt chart templates to download. By the end, you’ll be able to build and customize Gantt charts for your own projects.
Free Gantt Chart and Project-Tracking Templates
Instead of spending hours setting up Gantt charts from scratch, we’ve done the heavy lifting for you.
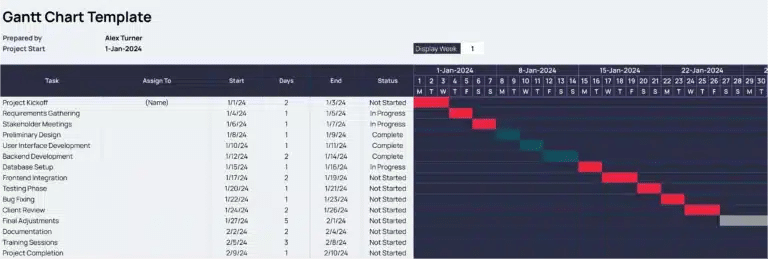
Coefficient’s Gantt Chart Template has all the formulas and formatting ready to go. Grab it here!
Not what you’re looking for? Check out one of our other time-tracking templates below!
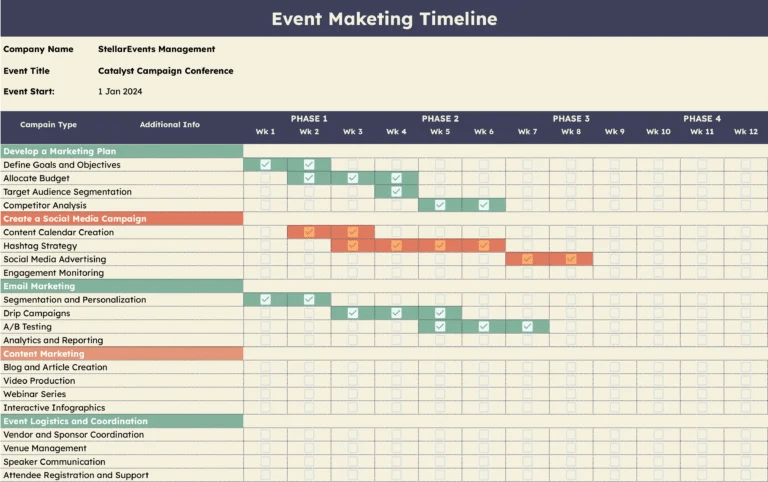
Event timeline template (link)
Strategic planning timeline template (link)

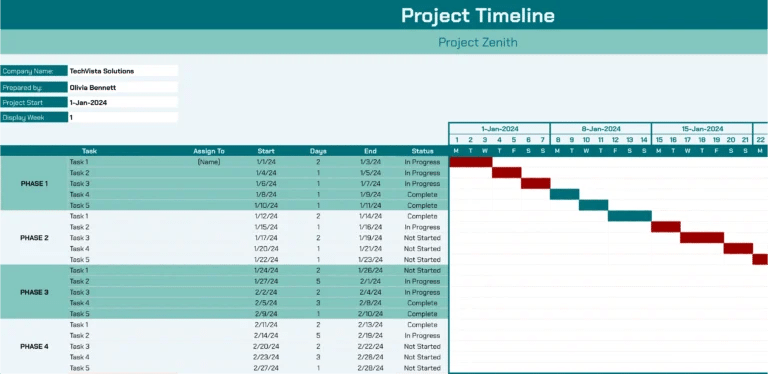
Project timeline template (link)
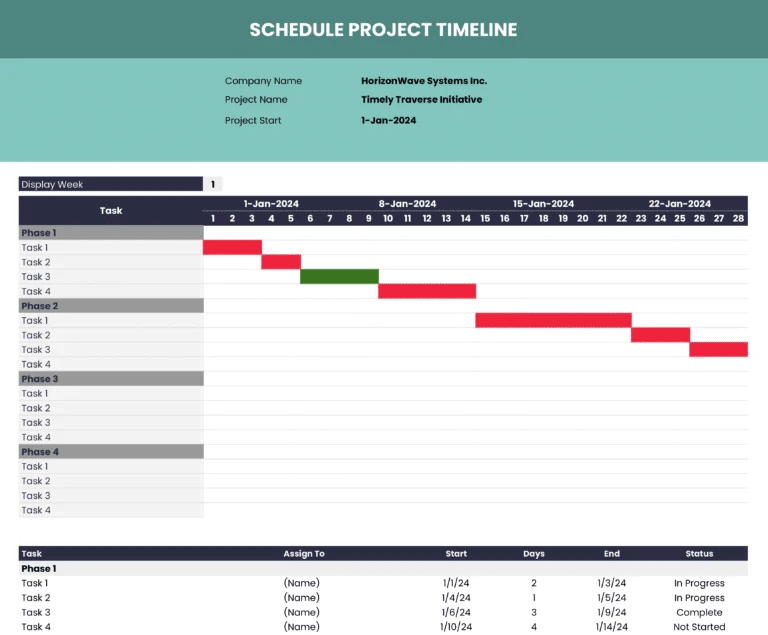
Project Schedule with Timeline Template (link)
Rather do things the old-fashioned way? Continue on to learn how to create a Gantt Chart from scratch!
How to Create a Gantt Charts in Excel: A Step-by-Step Guide
Excel is a popular choice for creating Gantt charts due to its widespread availability and familiarity. Follow these steps to build a Gantt chart in Excel:
Step 1: Define Your Project Tasks
Begin by identifying and listing all the tasks or activities that need to be completed for your project. This foundational step will create the backbone of your Gantt chart and should include:
- Task Names: Descriptive titles for each task.
- Task Descriptions: Brief details on what each task involves.
- Milestones: Key achievements or checkpoints within your project.
Example:
- Task Name: “Market Research”
- Task Description: “Conduct research to understand market needs and trends.”
- Milestone: “Complete research report.”
Step 2: Assign Start and End Dates
For each task, determine the start and end dates. These dates should reflect when each task is scheduled to begin and finish, considering any dependencies or constraints. This involves:
- Identifying Dependencies: Determine which tasks must be completed before others can begin.
- Setting Deadlines: Establish firm deadlines for each task based on project timelines.
Example:
- Task: “Market Research”
- Start Date: “June 1, 2024”
- End Date: “June 10, 2024”
Step 3: Create the Gantt Chart
In Excel, you can create a Gantt chart using various methods:
a. Using Excel’s Built-in Gantt Chart Template
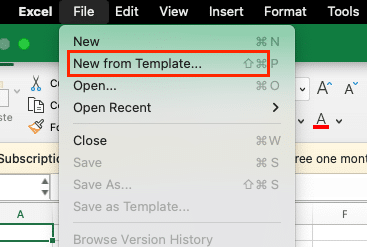
- Open Excel: Go to File > New fom Template and search for “Gantt Chart.”
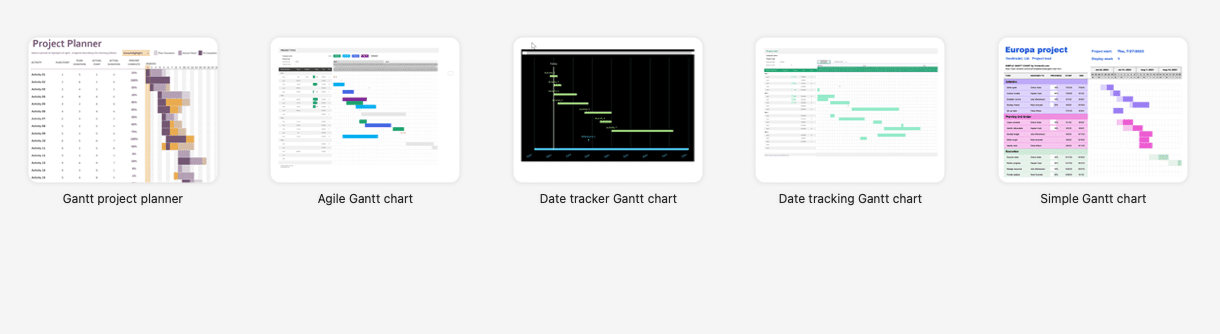
- Select Template: Choose a Gantt chart template that suits your project.
- Input Data: Replace placeholder data with your project’s tasks, start dates, and end dates.
b. Creating a Custom Gantt Chart
- Prepare Your Data: Organize your data into columns for Task Names, Start Dates, End Dates, and Duration.

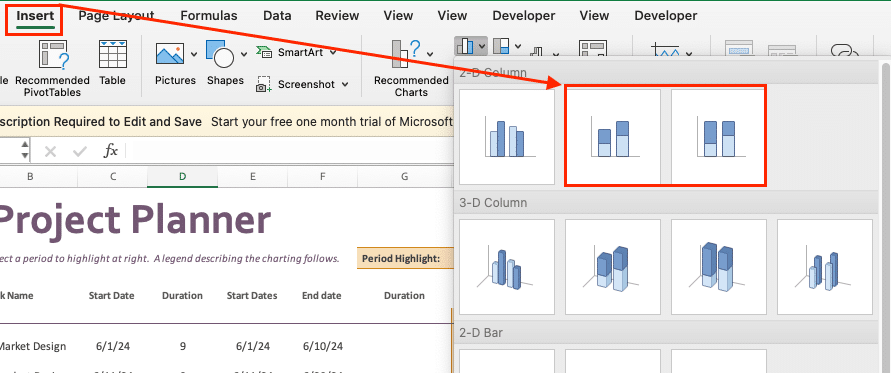
- Insert Bar Chart: Highlight the data range, go to the Insert tab, select Bar Chart, and choose the stacked bar chart type.
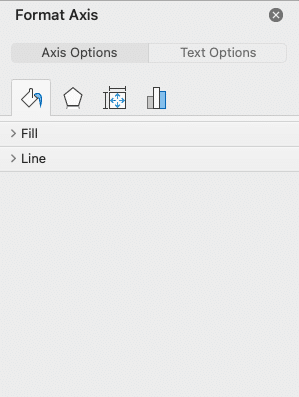
- Format the Chart:
- Adjust Bars: Format the bar chart to display tasks on the vertical axis and timeline on the horizontal axis.
- Remove Gaps: Right-click the bars, select Format Data Series, and set the gap width to 0%.
- Add Task Names: Use the “Select Data” option to edit the Horizontal (Category) Axis Labels with your Task Names
.
Step 4: Customize the Chart
Once you’ve selected the right Gantt chart template for your project, it’s time to start customizing it to fit your specific needs. Gantt charts are highly versatile, allowing you to tailor the visual elements, data inputs, and functionality to match your project management style and requirements.
Formatting and Styling
One of the first things you’ll want to do is adjust the formatting and styling of your Gantt chart. This includes:
- Color-coding: Use different colors to represent various project elements, such as task status, resource assignments, or milestone types. This can help you quickly identify important information at a glance.
- Gridlines and borders: Adjust the thickness, color, and visibility of gridlines and borders to improve readability and emphasize key information.
- Font styles and sizes: Choose fonts and font sizes that are easy to read, both on-screen and when printed.
- Shading and highlighting: Use shading or highlighting to draw attention to critical tasks, dependencies, or other important project details.
Adding Custom Data Fields

Stop exporting data manually. Sync data from your business systems into Google Sheets or Excel with Coefficient and set it on a refresh schedule.
Get Started
Gantt charts in Excel allow you to add custom data fields to track additional project information. Some examples include:
- Task dependencies: Identify task relationships and dependencies to better understand project flow.
- Resource assignments: Assign specific resources (people, equipment, etc.) to each task.
- Actual vs. planned dates: Compare planned start and end dates with actual progress to identify delays or areas for improvement.
- Budget and cost information: Integrate budget and cost data to monitor project spending.
By incorporating these custom data fields, you can gain deeper insights into your project and make more informed decisions.
Step 5: Update the Chart
As your project progresses, regularly update the Gantt chart to reflect:
- Changes in Task Status: Mark tasks as completed, in progress, or delayed.
- Timeline Adjustments: Modify start and end dates as project timelines evolve.
- Resource Reallocation: Adjust resources as needed to meet project demands.
Example:
- Task Update: Mark “Market Research” as completed on June 10, 2024.
- Timeline Adjustment: Extend the “Product Design” end date if delayed.
Gantt Chart Templates 101: The Basics
A Gantt chart is a type of bar chart that illustrates a project schedule, displaying the start and end dates of the various tasks or activities that make up a project. These charts are named after their inventor, Henry Gantt, who developed the concept in the early 20th century.
Gantt charts are invaluable for project management because they provide a clear, visual representation of a project’s timeline, allowing you to easily track progress, identify dependencies, and make informed decisions about resource allocation.
By using a Gantt chart, you can:
- Visualize the sequence and duration of tasks within a project
- Identify dependencies between tasks and potential bottlenecks
- Monitor the progress of individual tasks and the overall project
- Communicate the project plan and timeline to stakeholders
Why Use a Gantt Chart Template?
Gantt charts are versatile and can be used for a wide range of projects, from small-scale personal endeavors to large-scale enterprise initiatives. Their ability to organize and communicate complex information in a simple, easy-to-understand format makes them an indispensable tool for project managers and teams of all sizes.
While creating a Gantt chart from scratch is possible, using a template can save you time and effort. Here are some reasons why:
- Time-saving: With a template, you don’t have to worry about setting up the basic structure of the chart. Simply input your project data, and you’re ready to go.
- Consistency: Templates ensure that all your Gantt charts follow a consistent format, making them easier to read and understand across different projects.
- Customizability: Most templates are customizable, allowing you to tailor them to your specific project needs. You can add or remove columns, change colors, and adjust timelines as needed.
- Ease of use: Many Gantt chart templates are designed with user-friendliness in mind. Even if you’re new to Gantt charts, you’ll find them intuitive and easy to work with.
Don’t Create a Gantt Chart from Scratch
Gantt chart templates in Excel can make project management more efficient. By customizing these templates and applying useful techniques, you’ll improve your workflow and project tracking. Coefficient’s free Gantt chart templates offer a solid starting point for your projects.
These templates, combined with real-time data connections, can help you stay on top of project timelines and tasks. Ready to try it out? Get started with Coefficient today!


