
Are you struggling to make complex business decisions? Excel Solver can help you optimize your choices and maximize results. This comprehensive guide will walk you through everything you need to know about Excel Solver, from basic setup to advanced problem-solving techniques.
Getting Started with Excel Solver
Before you can start using Excel Solver, you need to ensure it’s properly set up in your Excel environment. Let’s walk through the process of enabling and locating Solver in different Excel versions.
How to Enable the Solver Add-in
To enable the Solver Add-in, follow these steps:
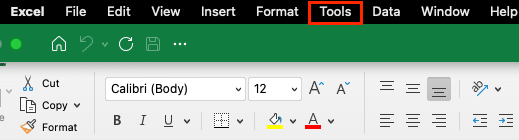
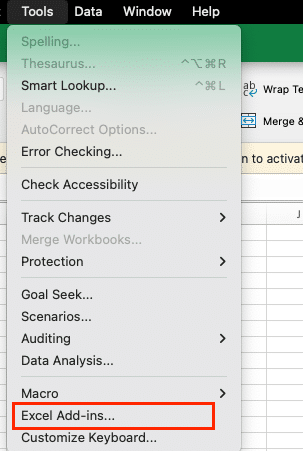
- Open Excel and click on the “Tool” tab.
- In the Excel Options window, click on “Excel Add-Ins.”
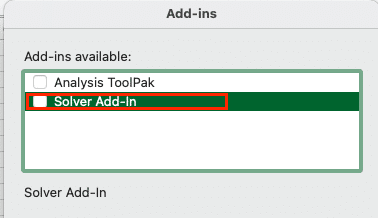
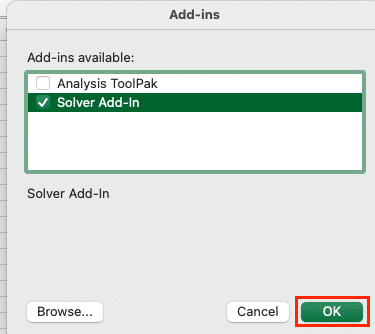
- In the Add-Ins window, check the box next to “Solver Add-in.”
- Click “OK.”
Excel may need to install the add-in if it’s not already on your system. Follow any prompts to complete the installation.
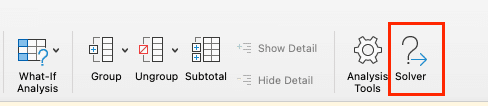
Locating Solver in Different Excel Versions
Once enabled, Solver’s location varies slightly depending on your Excel version:
Excel 2010 and later:
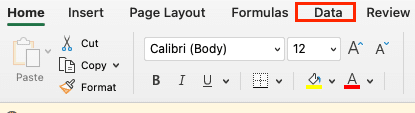
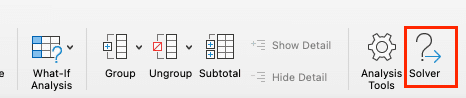
- Click on the “Data” tab in the Excel ribbon.
- Look for the “Analyze” group.
- Click on “Solver.”
Excel 2007:
- Click on the “Data” tab in the Excel ribbon.
- Look for the “Analysis” group.
- Click on “Solver.”
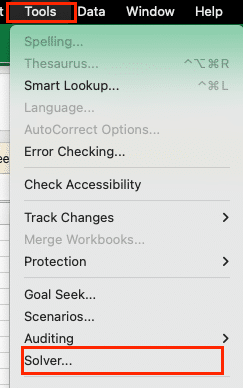
Excel 2003 and earlier:
- Click on “Tools” in the top menu.
- Select “Solver” from the dropdown list.
Understanding the Solver Interface
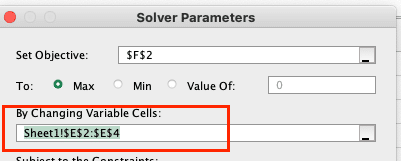
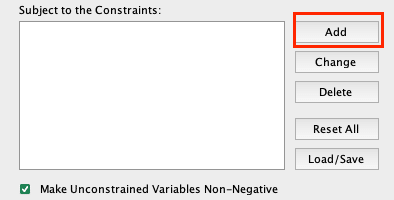
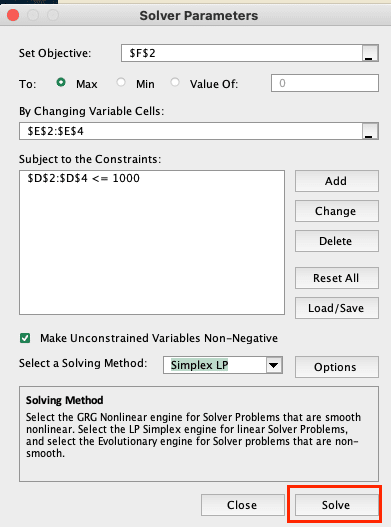
When you open Solver, you’ll see a dialog box with several key components:
- Set Objective: This is where you specify the cell containing the formula you want to optimize (maximize, minimize, or set to a specific value).
- To: Choose whether you want to maximize, minimize, or set the objective cell to a specific value.
- By Changing Variable Cells: Specify the cells that Solver can adjust to find the optimal solution.
- Subject to the Constraints: Add limitations or requirements for your solution.
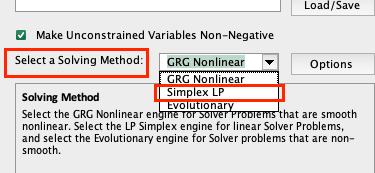
- Solving Method: Choose the algorithm Solver should use based on your problem type.
- Make Unconstrained Variables Non-Negative: Check this box if all your variables should be positive or zero.
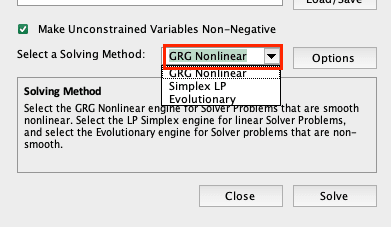
- Select a Solving Method: Choose from:
- GRG Nonlinear: For smooth, nonlinear problems
- Simplex LP: For linear problems
- Evolutionary: For non-smooth problems
- Solve: Click this button to run Solver and find a solution.
- Options: Access additional settings to fine-tune Solver’s behavior.
Step-by-Step Guide to Using Excel Solver
Now that you’re familiar with Solver’s interface, let’s walk through a step-by-step example of how to use it. We’ll use a simple product mix optimization problem to illustrate the process.
Defining Your Objective
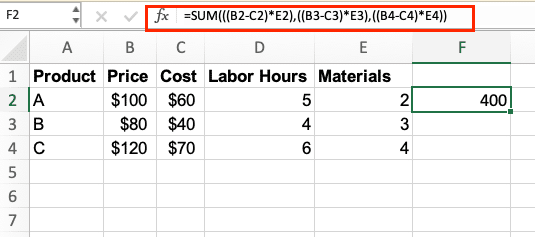
Step 1: Set up your spreadsheet. Create a table with your product information, including revenues, costs, and resource requirements.
| Product | Price | Cost | Labor Hours | Materials |
| A | $100 | $60 | 5 | 2 |
| B | $80 | $40 | 4 | 3 |
| C | $120 | $70 | 6 | 4 |
Step 2: Create decision variables. Add a column for the number of units to produce for each product.
Step 3: Calculate total profit. Create a cell that calculates the total profit based on the number of units produced. Formula: =SUM(((B2-C2)*E2),((B3-C3)*E3),((B4-C4)*E4))
Setting Up Variables and Constraints
Step 4: Open Solver Navigate to the “Data” tab and click on “Solver.”
Step 5: In the Solver Parameters dialog, set the objective to your “total profit cell”.

Step 6: Set the “changing variable cells” to the range containing the number of units to produce.
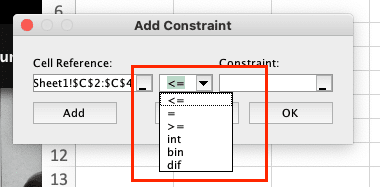
Step 7: Click “Add” to input your constraints:
- Labor hours: SUM(D2:D4*E2:E4) <= 1000
- Materials: SUM(E2:E4*F2:F4) <= 800
- Non-negativity: E2:E4 >= 0
Choosing a Solving Method
Step 8: Select the appropriate solving method. For this linear problem, choose “Simplex LP” as the solving method.
Running Solver and Interpreting Results
Step 9: Click “Solve” to run Solver.
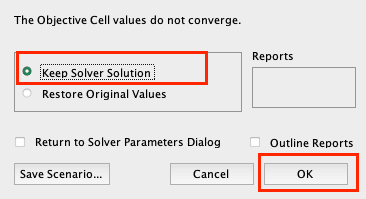
Step 10: Review the results the Solver’s will display a dialog box with the results. If a solution is found, you’ll see the optimal values for your decision variables and the maximized profit.
Step 11: Select “Keep Solver Solution” and click “OK.”
Fine-tuning Your Model
Step 12: Analyze the sensitivity report Generate a sensitivity report to understand how changes in your parameters might affect the optimal solution.
Step 13: Adjust constraints or variables Based on the sensitivity report, you may want to adjust your constraints or add new variables to refine your model.
Step 14: Re-run Solver After making adjustments, run Solver again to see how the changes impact your solution.
Advanced Excel Solver Techniques
Once you’re comfortable with basic Solver operations, you can explore more advanced techniques to tackle complex problems.

Stop exporting data manually. Sync data from your business systems into Google Sheets or Excel with Coefficient and set it on a refresh schedule.
Get Started
Working with Non-linear Problems
Non-linear problems involve relationships between variables that aren’t straight lines. To solve these:
- Set up your model with appropriate non-linear formulas.
- In Solver, select “GRG Nonlinear” as the solving method.
- Be aware that non-linear problems may have multiple local optima, so you might need to run Solver multiple times with different starting points.
Using Integer Constraints
For problems where variables must be whole numbers:
- Set up your model as usual.
- In the Solver constraints dialog, add a constraint for the relevant cells.
- Change the constraint type to “int” for integer values or “bin” for binary (0 or 1) values.
- Use the “Evolutionary” solving method for complex integer problems.
Sensitivity Analysis and Scenario Management
Sensitivity analysis helps you understand how changes in your model’s parameters affect the optimal solution:
- After solving your problem, click “Sensitivity” in the Solver Results dialog.
- Review the sensitivity report to identify which constraints are binding and how changes might impact your solution.
For scenario management:
- Use Excel’s Scenario Manager (found in the Data tab) in conjunction with Solver.
- Create different scenarios by varying key parameters.
- Run Solver for each scenario to compare outcomes.
What is Excel Solver?
Excel Solver is a powerful optimization tool built into Microsoft Excel. It helps users find the best solution to complex problems involving multiple variables and constraints. Unlike other Excel functions that perform specific calculations, Solver uses sophisticated algorithms to determine optimal values for a set of changing cells, subject to certain limitations.
Definition and Purpose
Excel Solver is an add-in that extends Excel’s analytical capabilities. Its primary purpose is to solve optimization problems, where the goal is to find the best possible solution given a set of constraints. Solver can handle various types of problems, including:
- Linear programming
- Non-linear programming
- Integer programming
How Solver Differs from Other Excel Functions
While Excel offers many built-in functions for data analysis and calculation, Solver stands out for its ability to handle complex, multi-variable problems. Here’s how it differs from other Excel functions:
- Optimization focus: Unlike functions that perform specific calculations, Solver finds the optimal solution to a problem.
- Multiple variables: Solver can handle problems with numerous variables, whereas most Excel functions work with a limited set of inputs.
- Constraint handling: Solver allows you to set constraints on your variables, which is not possible with standard Excel functions.
- Iterative process: Solver uses an iterative approach to find the best solution, trying different combinations until it reaches the optimal result.
Types of Problems Solver Can Address
Excel Solver is versatile and can tackle a wide range of business and analytical problems. Some common applications include:
- Resource allocation
- Production planning
- Financial modeling
- Supply chain optimization
- Portfolio management
- Scheduling
- Transportation and logistics
Excel Solver Alternatives and Complementary Tools
While Excel Solver is powerful, there are other tools you might consider for optimization problems:
OpenSolver for Excel
OpenSolver is a free, open-source alternative to Excel Solver that offers:
- Ability to handle larger problems
- More solving methods
- Visualization tools for linear programs
Other Optimization Add-ins and Software
- Frontline Solvers: Offers more advanced versions of Solver with additional capabilities.
- Lindo: Provides a suite of optimization tools for various problem types.
- CPLEX: IBM’s high-performance mathematical programming solver.
When to Use Solver vs. Other Analytical Tools
Choose Solver when:
- You need to find an optimal solution subject to constraints.
- Your problem involves multiple variables and complex relationships.
- You want to perform what-if analysis on your business decisions.
Consider other tools when:
- You need simple data analysis (use Excel’s built-in functions or Data Analysis ToolPak).
- Your problem requires advanced statistical analysis (consider R or Python).
- You’re dealing with extremely large datasets (look into database solutions or big data tools).
Here’s the comparison table:
| Feature/Tool | Excel Solver | OpenSolver | Frontline Solvers | Lindo | CPLEX |
| Cost | Included with Excel | Free | Paid (various tiers) | Paid | Paid |
| Integration | Native to Excel | Excel add-in | Excel add-in | Standalone with Excel connection | Standalone with APIs |
| Problem Size Limit | Limited (200 variables, 100 constraints) | Larger than Excel Solver | Depends on version, larger than Excel Solver | Very large | Very large |
| Solving Methods | Simplex LP, GRG Nonlinear, Evolutionary | More options than Excel Solver | Advanced algorithms, including global optimization | Wide range of algorithms | High-performance algorithms |
| Ease of Use | Moderate | Similar to Excel Solver | Moderate to Advanced | Advanced | Advanced |
| Visualization Tools | Limited | Better than Excel Solver | Advanced | Advanced | Limited |
| Best For | Small to medium-sized problems in Excel | Larger Excel-based problems | Advanced Excel users, professional analysts | Operations research, advanced optimization | Large-scale industrial optimization |
| Programming Required | No | No | No (Excel interface) | Yes (for advanced use) | Yes |
| Cloud/Web Version | No (unless using Excel Online) | No | Yes (some versions) | Yes | Yes |
Conclusion
By mastering Excel Solver and understanding its alternatives, you’ll be well-equipped to tackle a wide range of business optimization challenges. Remember to practice with different problem types and continuously refine your models for the best results.
Ready to take your data analysis to the next level? Discover how Coefficient can enhance your Excel and Google Sheets experience with real-time data integration and advanced analytics features. Get started with Coefficient today and unlock the full potential of your spreadsheet data!


