The Analysis ToolPak in Excel is a powerful suite of data analysis tools that helps you perform complex statistical and engineering calculations without advanced formula knowledge. Whether you’re analyzing sales data, conducting research, or processing large datasets, this add-in streamlines your analytical workflow and provides professional-grade results.
How to Use the Analysis ToolPak in Excel
Enable the Analysis ToolPak
- Open Excel and click the “File” tab
- Select “Options” from the menu
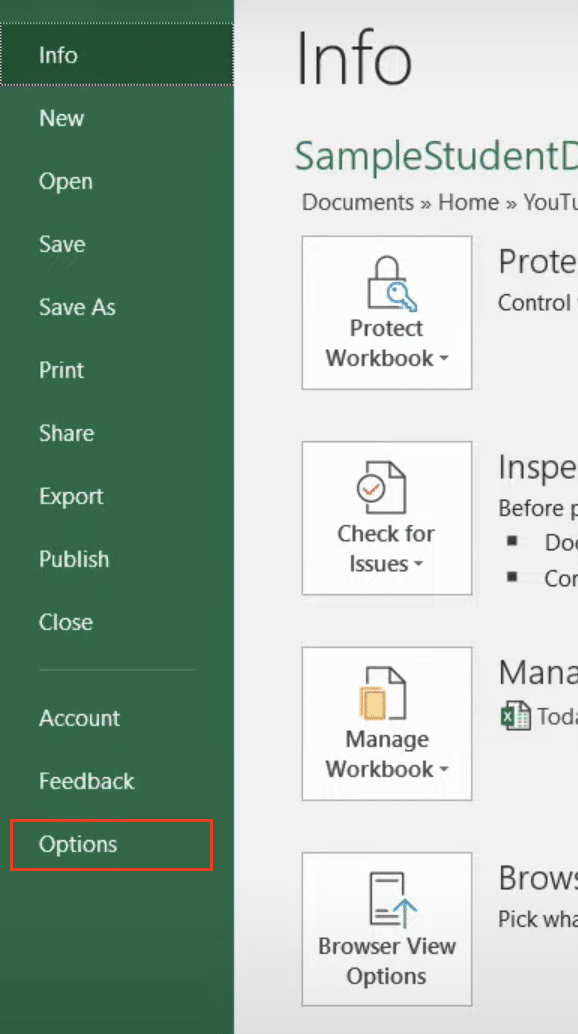
- Click “Add-ins” in the left sidebar
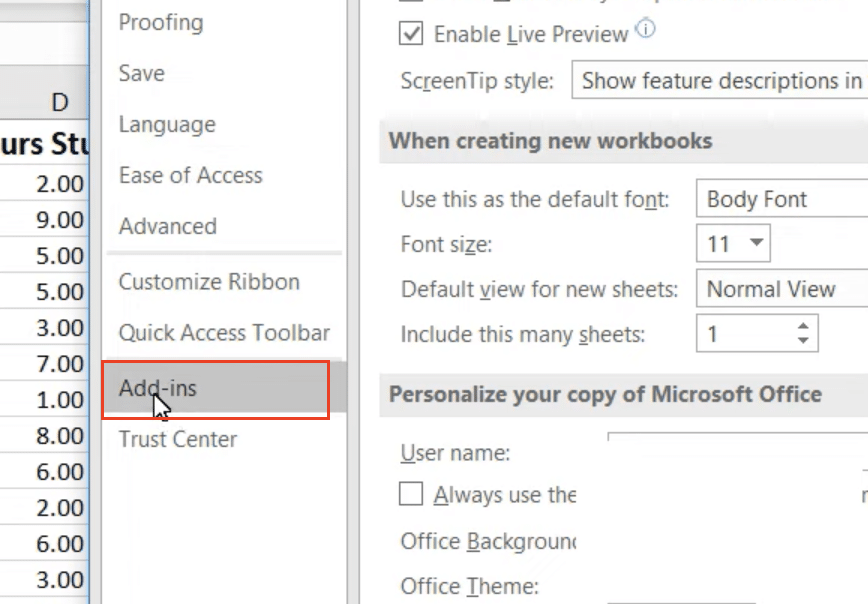
- At the bottom of the window, select “Excel Add-ins” from the “Manage” dropdown
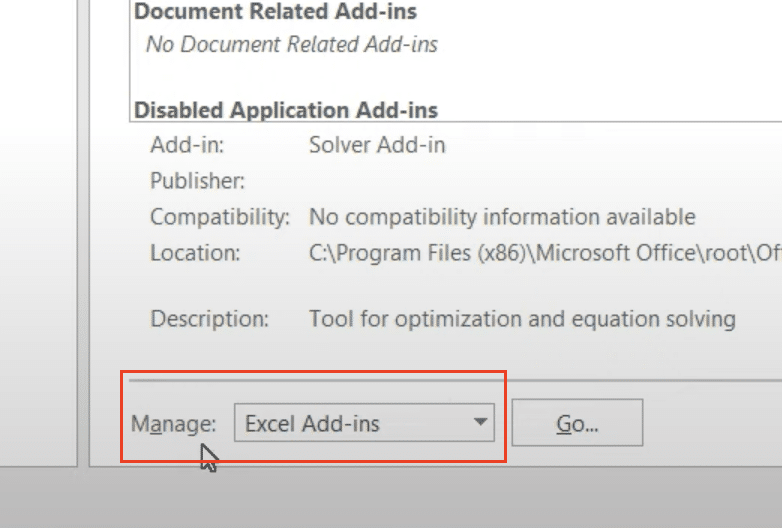
- Click “Go“
- Check the box next to “Analysis ToolPak“
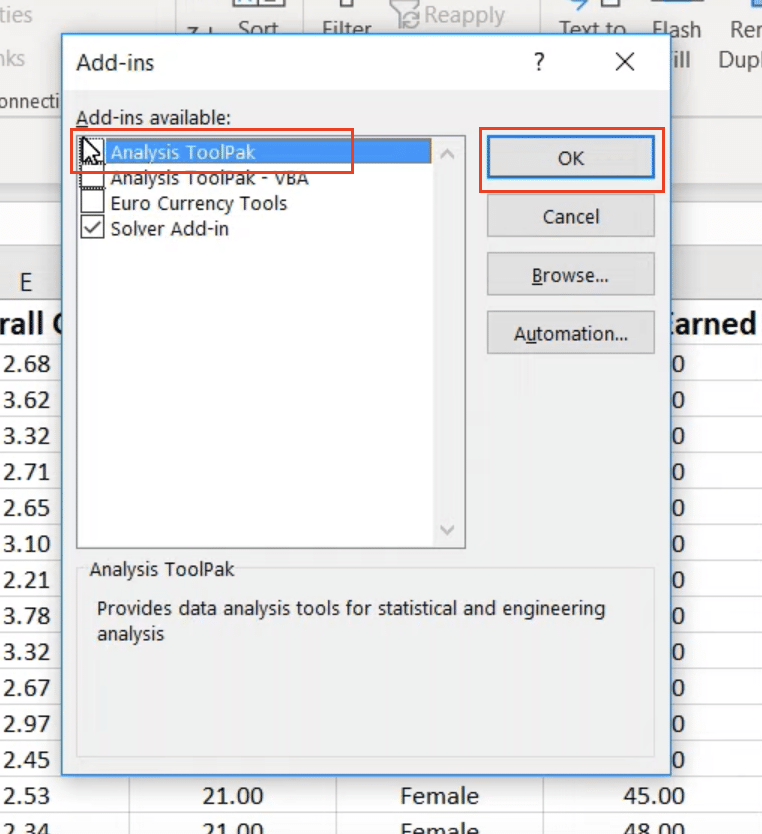
- Click “OK” to complete installation
Accessing Analysis Tools
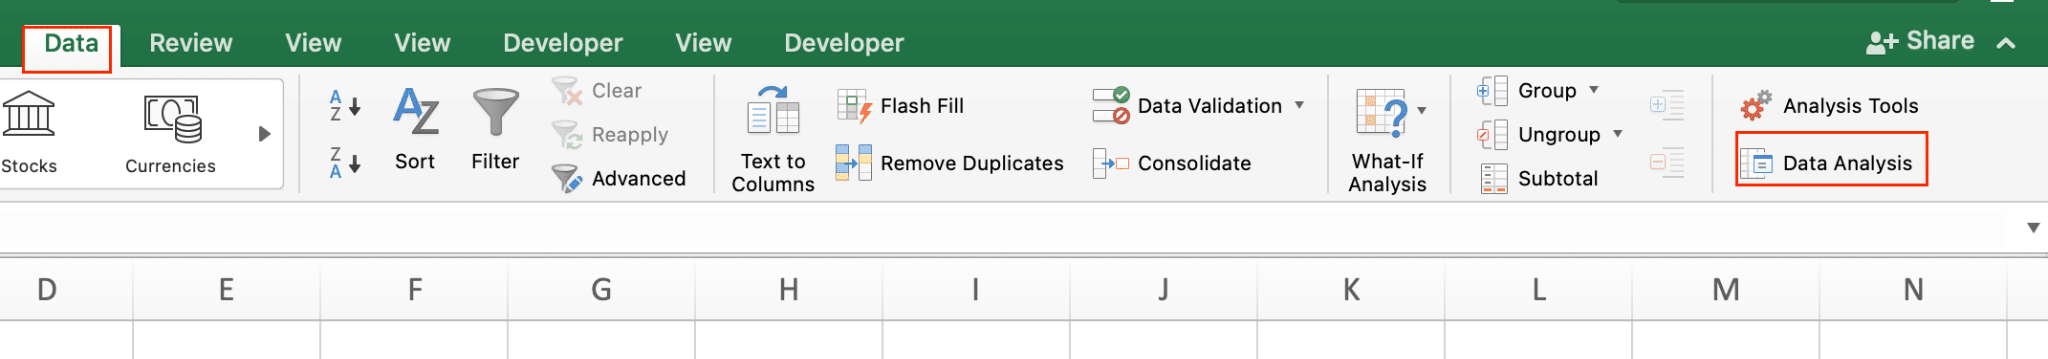
- Navigate to the “Data” tab in your Excel ribbon
- Look for the “Analysis” section
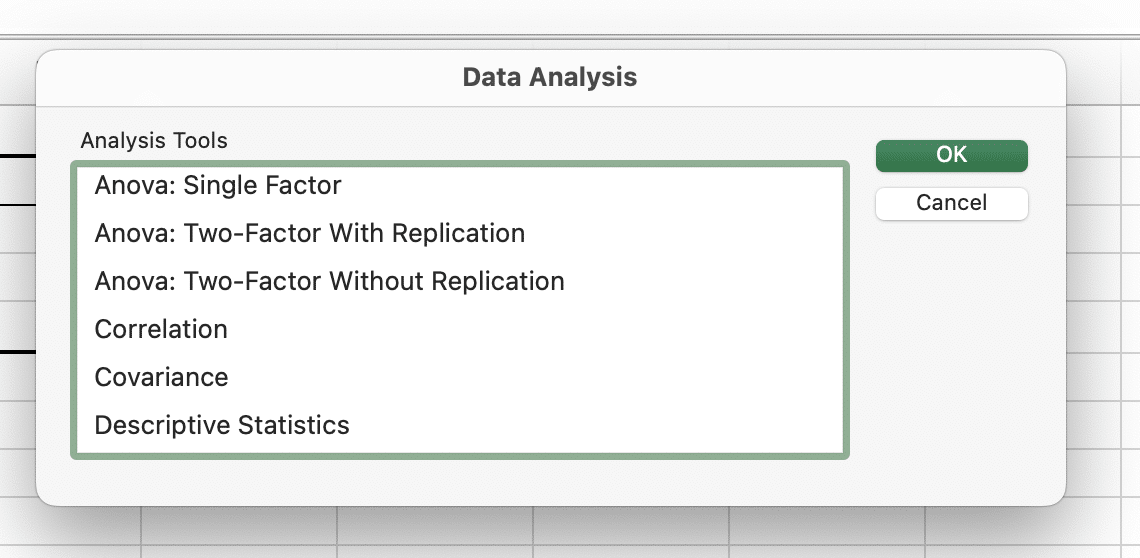
- Click “Data Analysis” to view available tools
Running Statistical Analysis
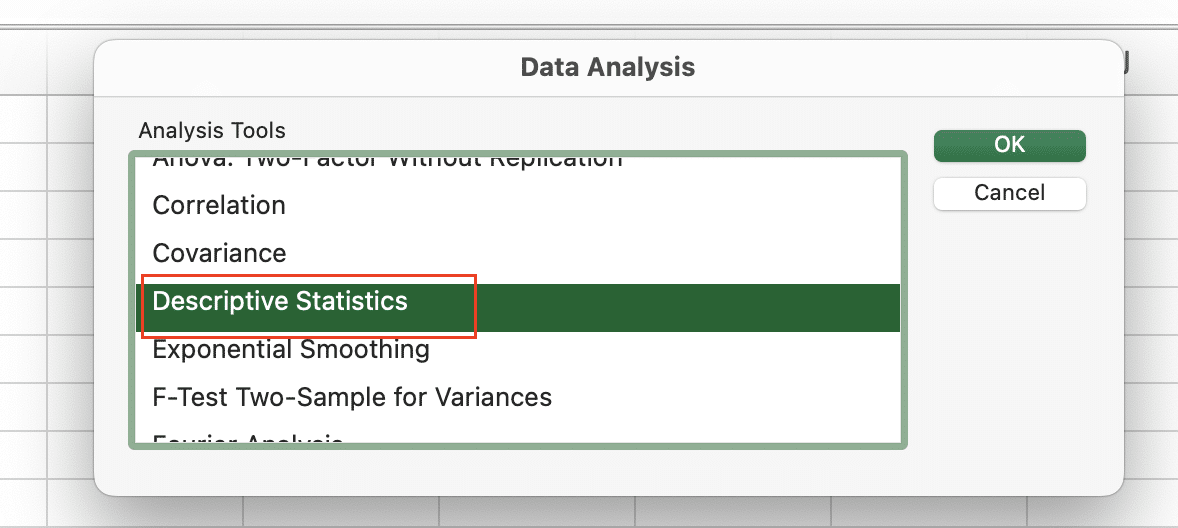
Descriptive Statistics
The Descriptive Statistics tool provides a comprehensive summary of your data’s central tendency and variability.
Example usage:
- Select “Data Analysis” > “Descriptive Statistics“
- Input Range: Select your data (e.g., A1:A100)
- Check “Summary statistics“
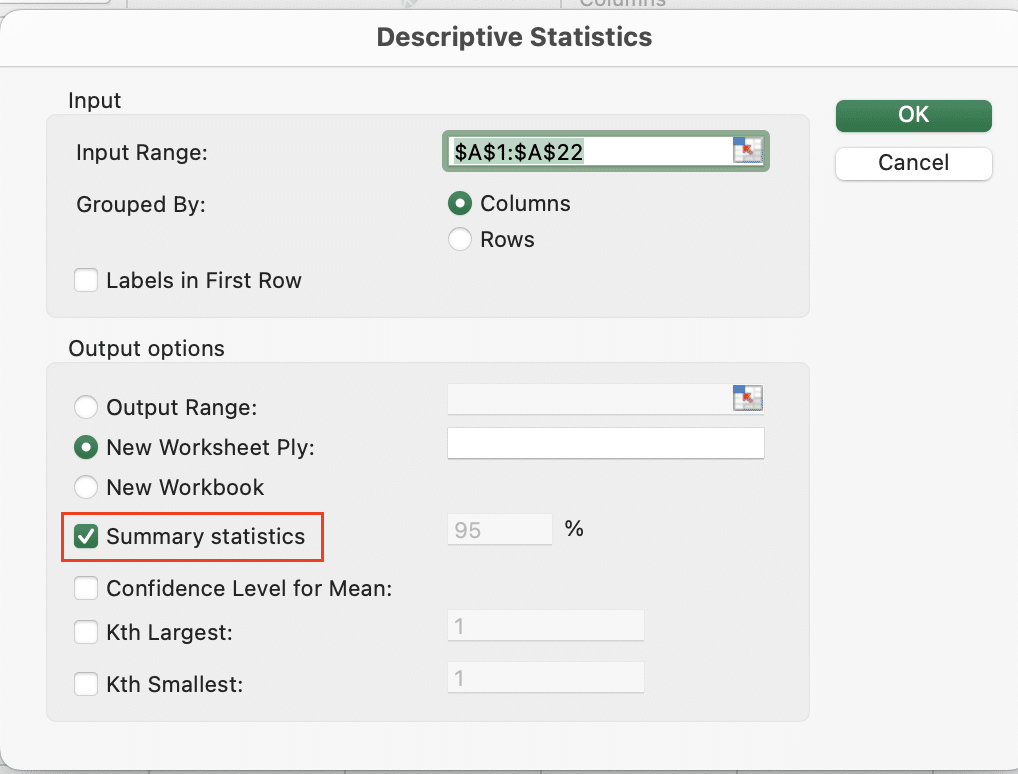
- Select output location
Sample output includes:
|
Statistic |
Value |
|---|---|
|
Mean |
42.5 |
|
Median |
41.0 |
|
Standard Deviation |
3.2 |
|
Variance |
10.24 |
|
Kurtosis |
-0.45 |
|
Skewness |
0.12 |
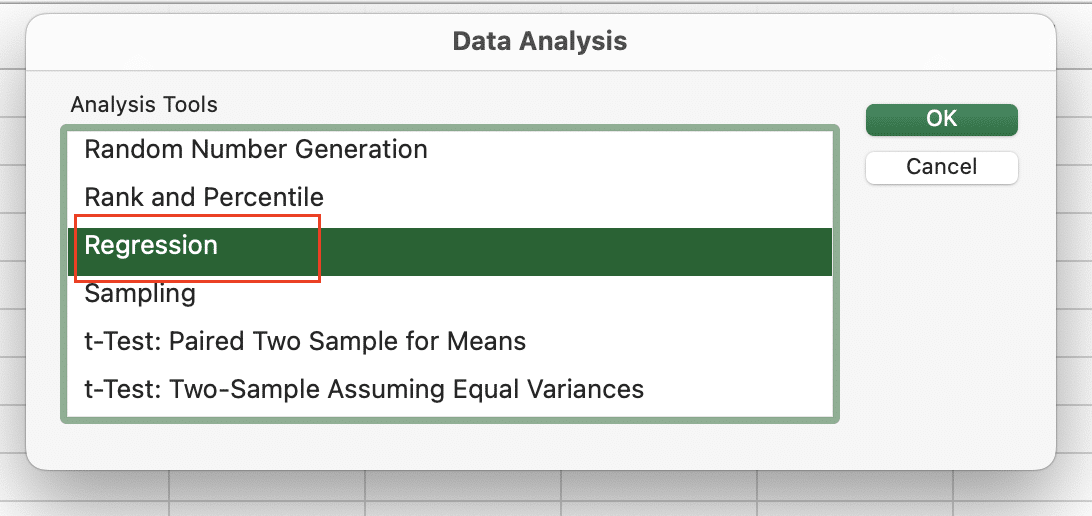
Regression Analysis
Regression analysis helps you understand relationships between variables.
Steps to perform regression:
- Select “Data Analysis” > “Regression“
- Input Y Range: Dependent variable (e.g., Sales)
- Input X Range: Independent variable(s) (e.g., Marketing Spend)
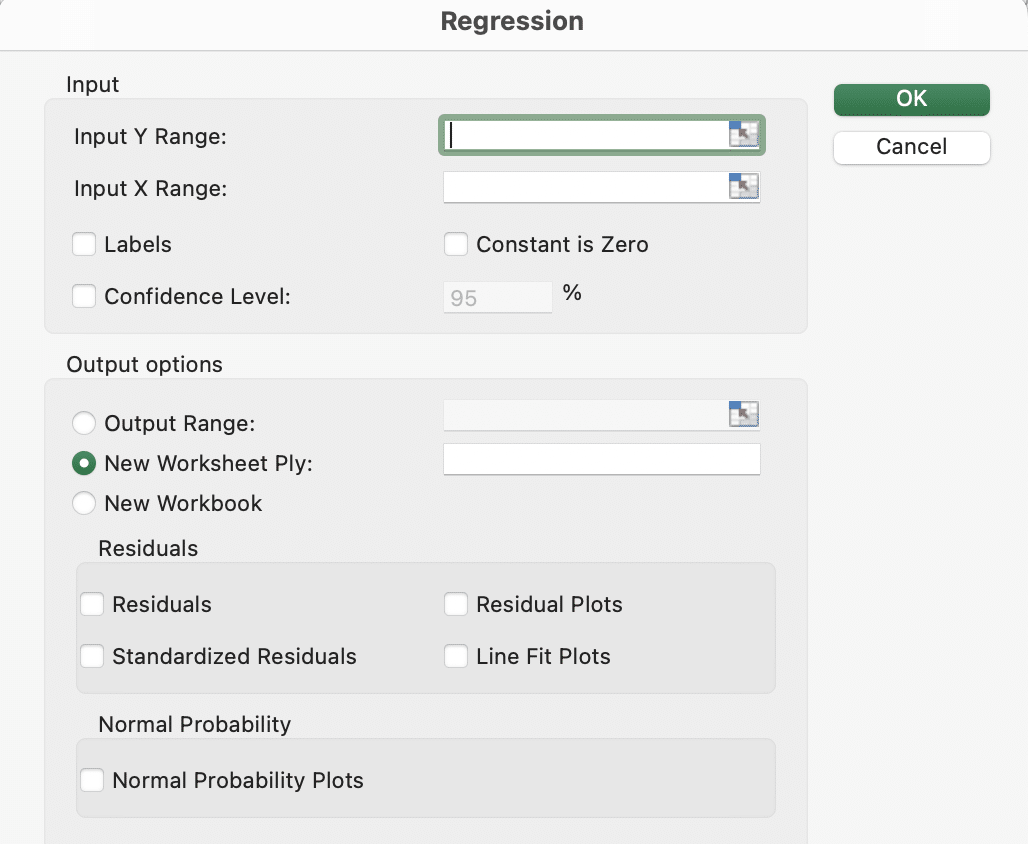
- Configure options:
- Labels in first row
- Confidence level (default 95%)
- Residuals
- Choose output location
Example output includes:
|
Regression Statistics |
|---|
|
Multiple R |
|
R Square |
|
Adjusted R Square |
|
Standard Error |
Correlation Analysis
To analyze relationships between multiple variables:
- Select “Data Analysis” > “Correlation“
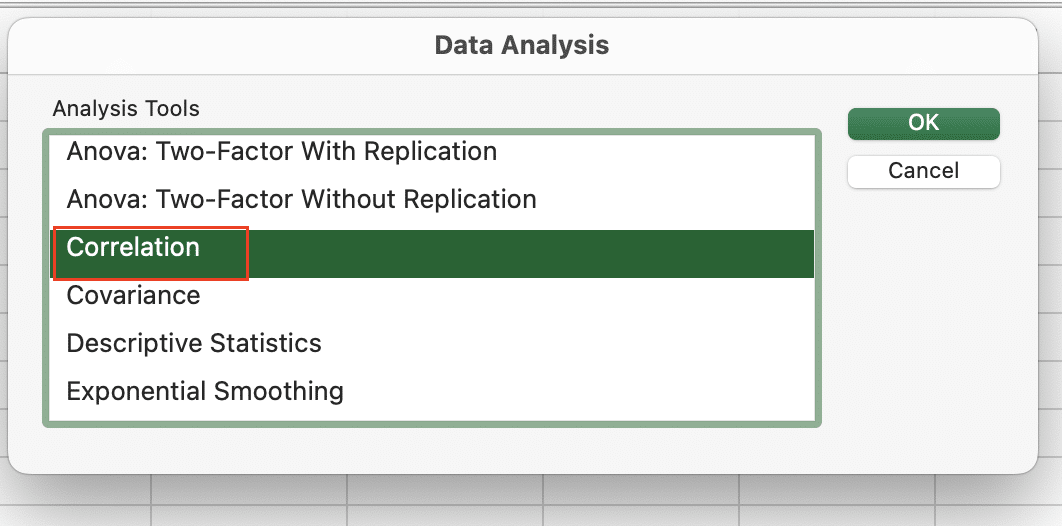
- Input Range: Select all variables
- Choose output options
Example correlation matrix:
|
Variables |
Price |
Demand |
Marketing |
|---|---|---|---|
|
Price |
1.00 |
-0.85 |
0.32 |
|
Demand |
-0.85 |
1.00 |
0.45 |
|
Marketing |
0.32 |
0.45 |
1.00 |
Working with Engineering Tools
Moving Averages
Calculate trends using moving averages:
- Select “Data Analysis” > “Moving Average“
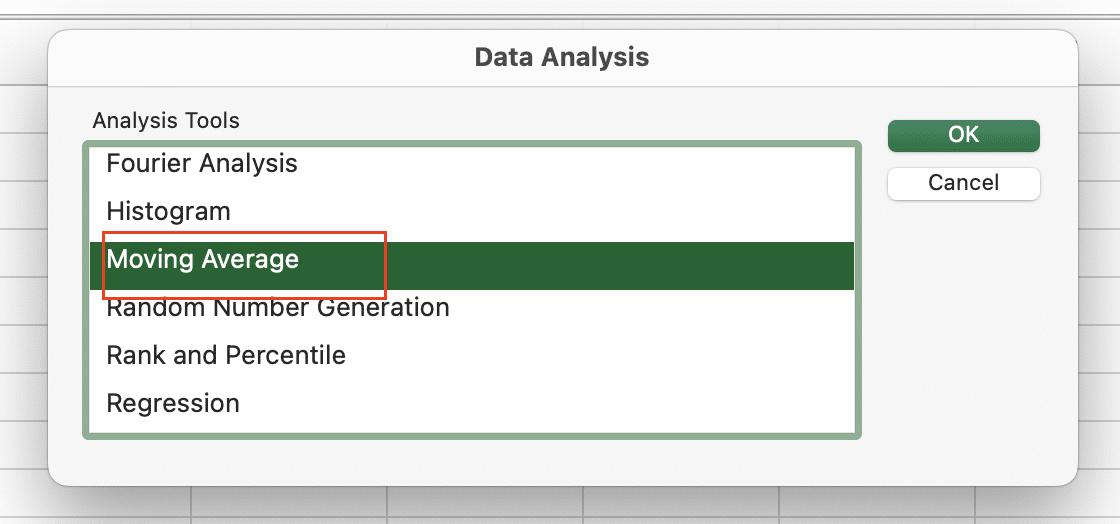
- Input Range: Time series data
- Interval: Number of periods
- Output options: Plot chart, standard errors
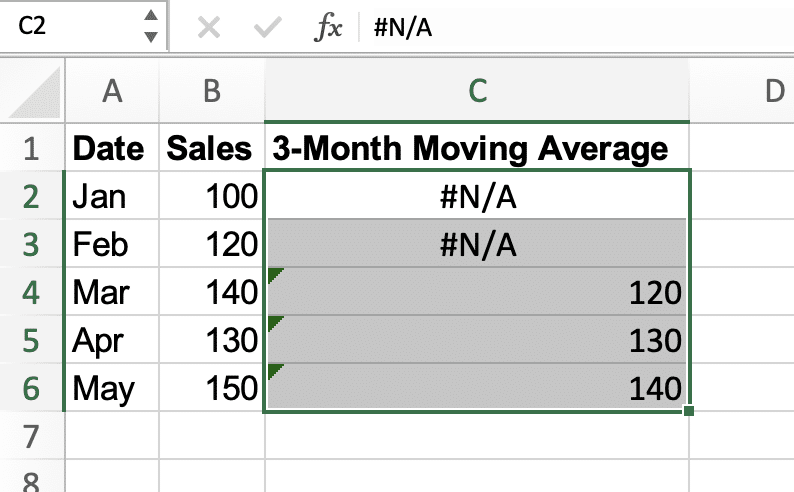
Example:
|
Date 
Try the Free Spreadsheet Extension Over 500,000 Pros Are Raving About
Stop exporting data manually. Sync data from your business systems into Google Sheets or Excel with Coefficient and set it on a refresh schedule. Get Started |
Sales |
3-Month Moving Average |
|---|---|---|
|
Jan |
100 |
– |
|
Feb |
120 |
– |
|
Mar |
140 |
120 |
|
Apr |
130 |
130 |
|
May |
150 |
140 |
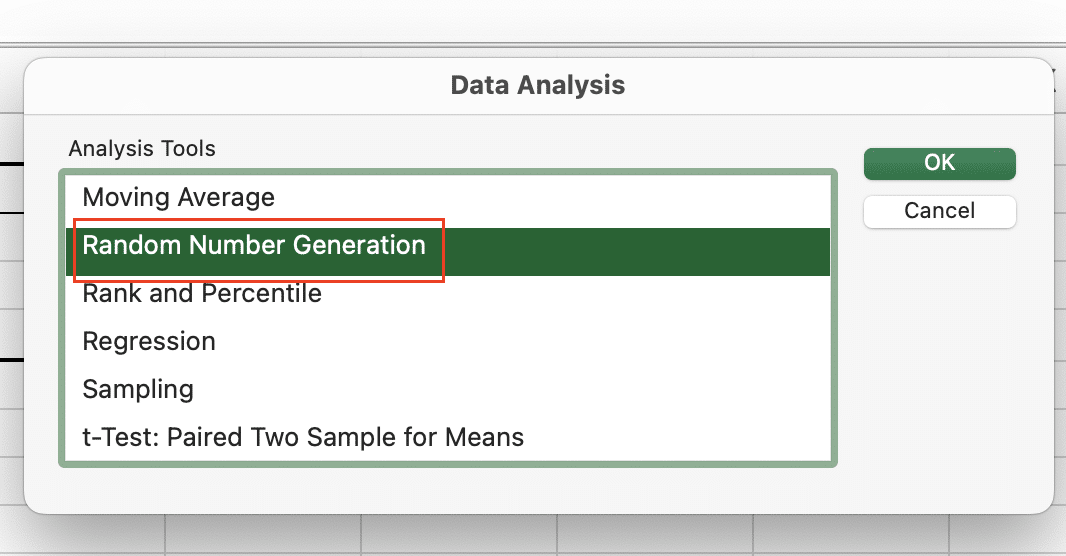
Random Number Generation
Generate random data for simulations:
- Select “Data Analysis” > “Random Number Generation“
- Choose distribution type:
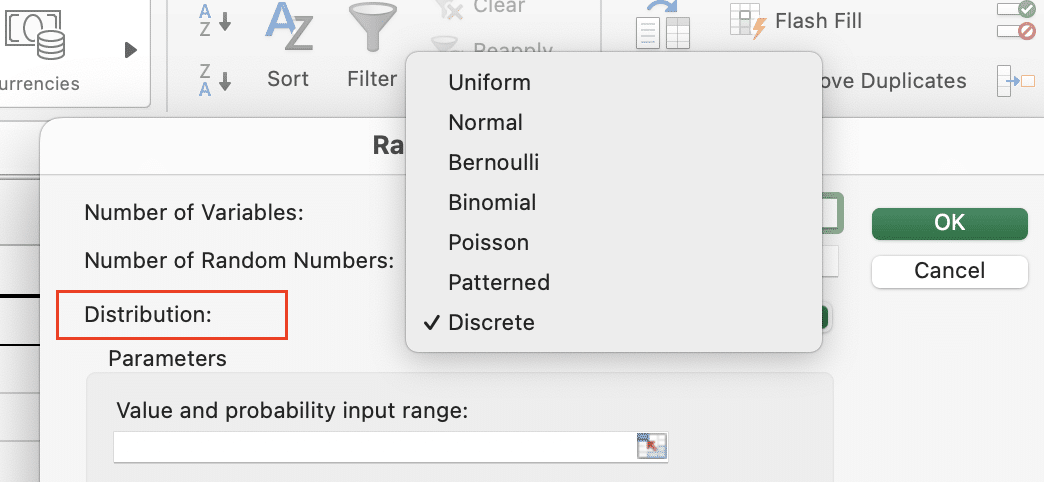
-
- Normal
- Uniform
- Bernoulli
- Binomial
- Poisson
- Set parameters
- Specify output range
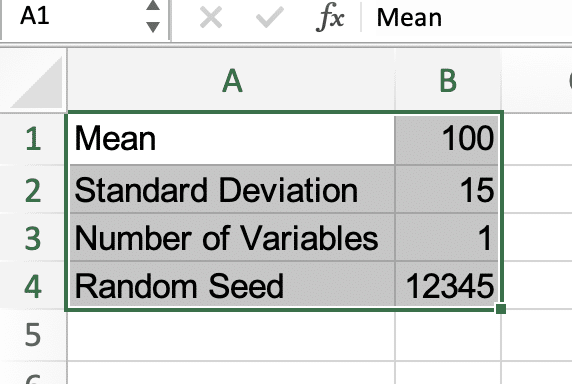
Example normal distribution parameters:
|
Parameter |
Value |
|---|---|
|
Mean |
100 |
|
Standard Deviation |
15 |
|
Number of Variables |
1 |
|
Random Seed |
12345 |
Platform-Specific Instructions
Windows Excel
- Data tab > Analysis section
- Click “Data Analysis“

- Select tool
- Configure parameters
- Choose output location
Mac Excel
- Tools menu > Data Analysis
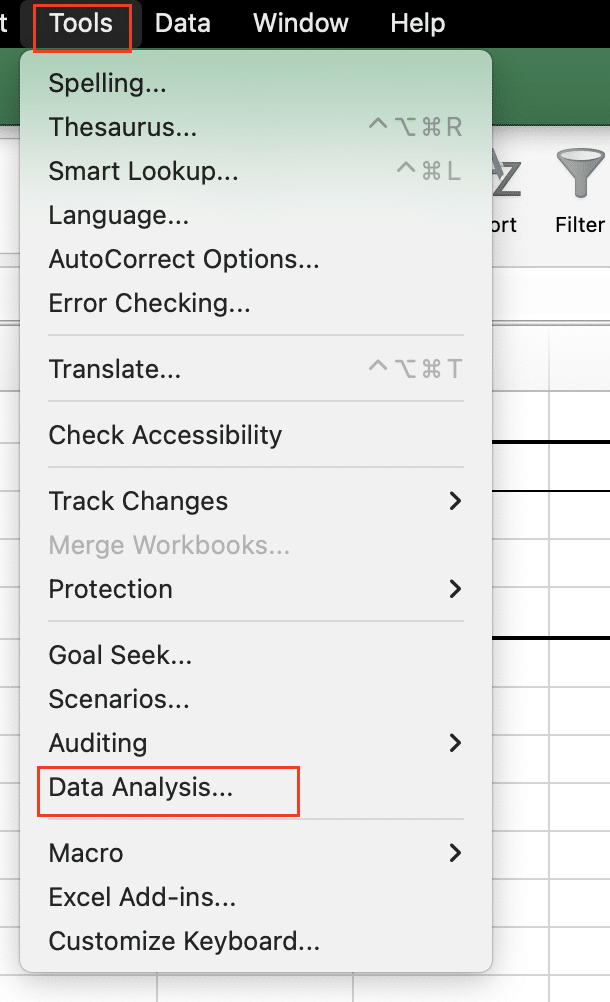
- Select analysis type
- Configure settings
- Select output destination
Advanced Tips
- Combine analyses:
- Use regression results in correlation analysis
- Feed moving averages into forecasting models
- Link descriptive statistics to dashboards
- Automate regular analyses:
- Record macros for repetitive analysis
- Create template worksheets
- Set up data validation rules
- Best practices:
- Always check data quality before analysis
- Document assumptions and parameters
- Save original data separately
- Validate results with different methods
Next Steps
The Analysis ToolPak transforms Excel into a powerful statistical analysis platform. Start with basic descriptive statistics, then progress to more advanced tools as you become comfortable with the interface and outputs.
Need to streamline your data analysis workflow further? Try Coefficient to automatically sync live data from your business systems directly into Excel, ensuring your analysis always uses the most current information.


