

Install Analysis ToolPak by going to File > Options > Add-Ins, then check the box next to “Analysis ToolPak”
Access the tool under the “Data” tab in the ribbon, labeled as “Data Analysis”
Prepare your data with consistent formatting, single header row, correct data types, and avoid merged cells
Use ToolPak for complex statistical analyses like regression, correlation, ANOVA, descriptive statistics, and t-tests
Leverage the specialized tools for deeper data exploration without external software for sophisticated scientific analysis
What is Analysis ToolPak?
The Analysis ToolPak tool has been added to Microsoft Excel and provides functions for advanced data analysis that are not included in the standard Excel functions. Complex statistical and engineering analyses such as regression, correlation, and ANOVA use Analysis ToolPak. Excel’s essential tools usually need help from users when they need to deal with complex statistical testing or massive datasets. The ToolPak is an effective tool in this regard by providing a set of tools capable of enabling the exploration and analysis of data at a deeper level without using any external software.
Importance of ToolPak for Advanced Data Analysis
ToolPak offers different kinds of data analysis, such as descriptive statistics, F-tests, t-tests, and Fourier analysis, all of which are critical in deciphering data trends and making informed decisions. Even though Excel’s routine functions are sufficient for basic calculations and data management, the Analysis ToolPak provides specialized tools vital for more sophisticated, scientific data analysis. Therefore, this tool is useful for researchers, data analysts, and anyone else working with complex datasets.
Now, let us understand in detail on how to install the Analysis ToolPak
Install the Analysis ToolPak
Here is a detailed step-by-step guide to install the Analysis ToolPak in Excel, ensuring you can effectively activate it and address common issues during installation:
Step 1: Access Excel Options
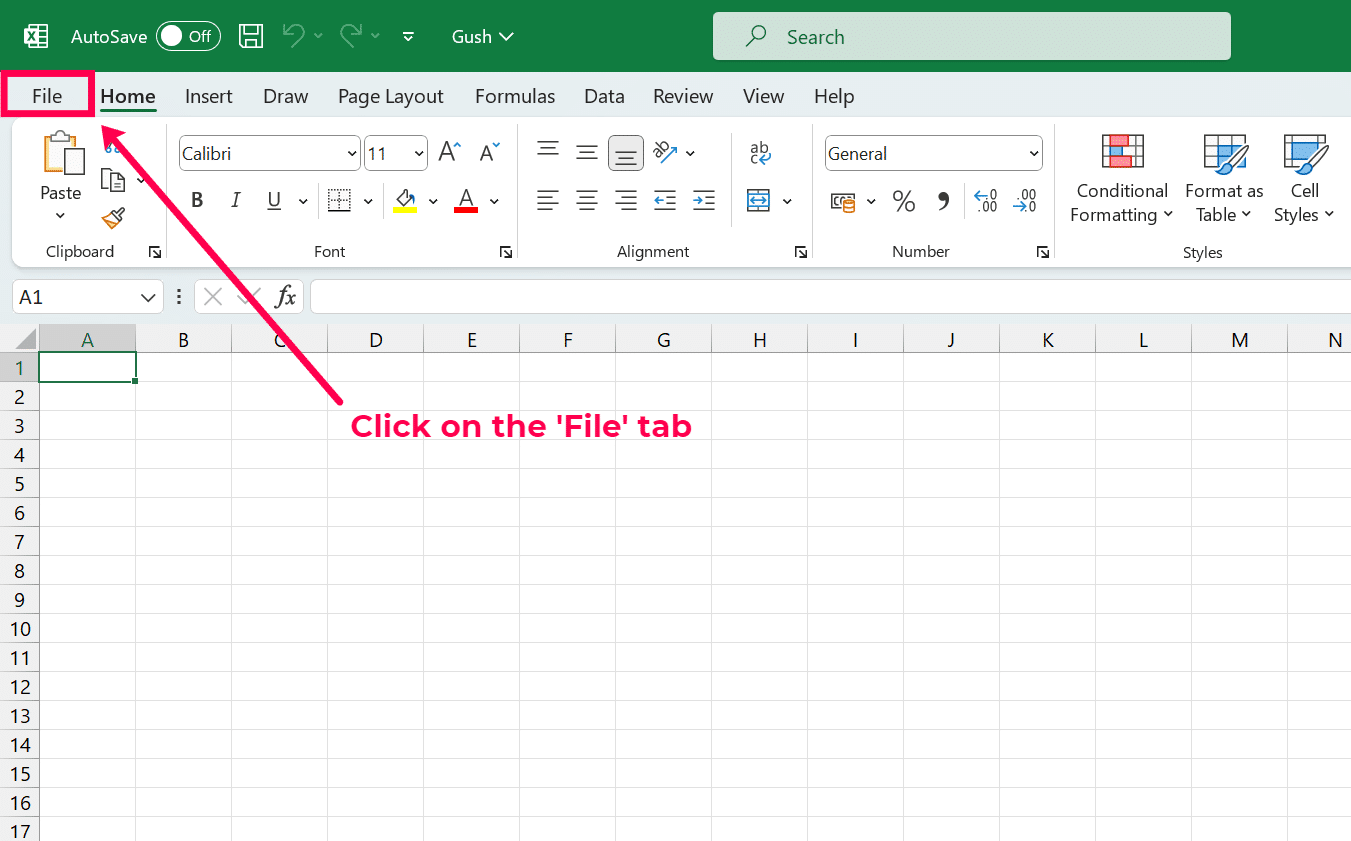
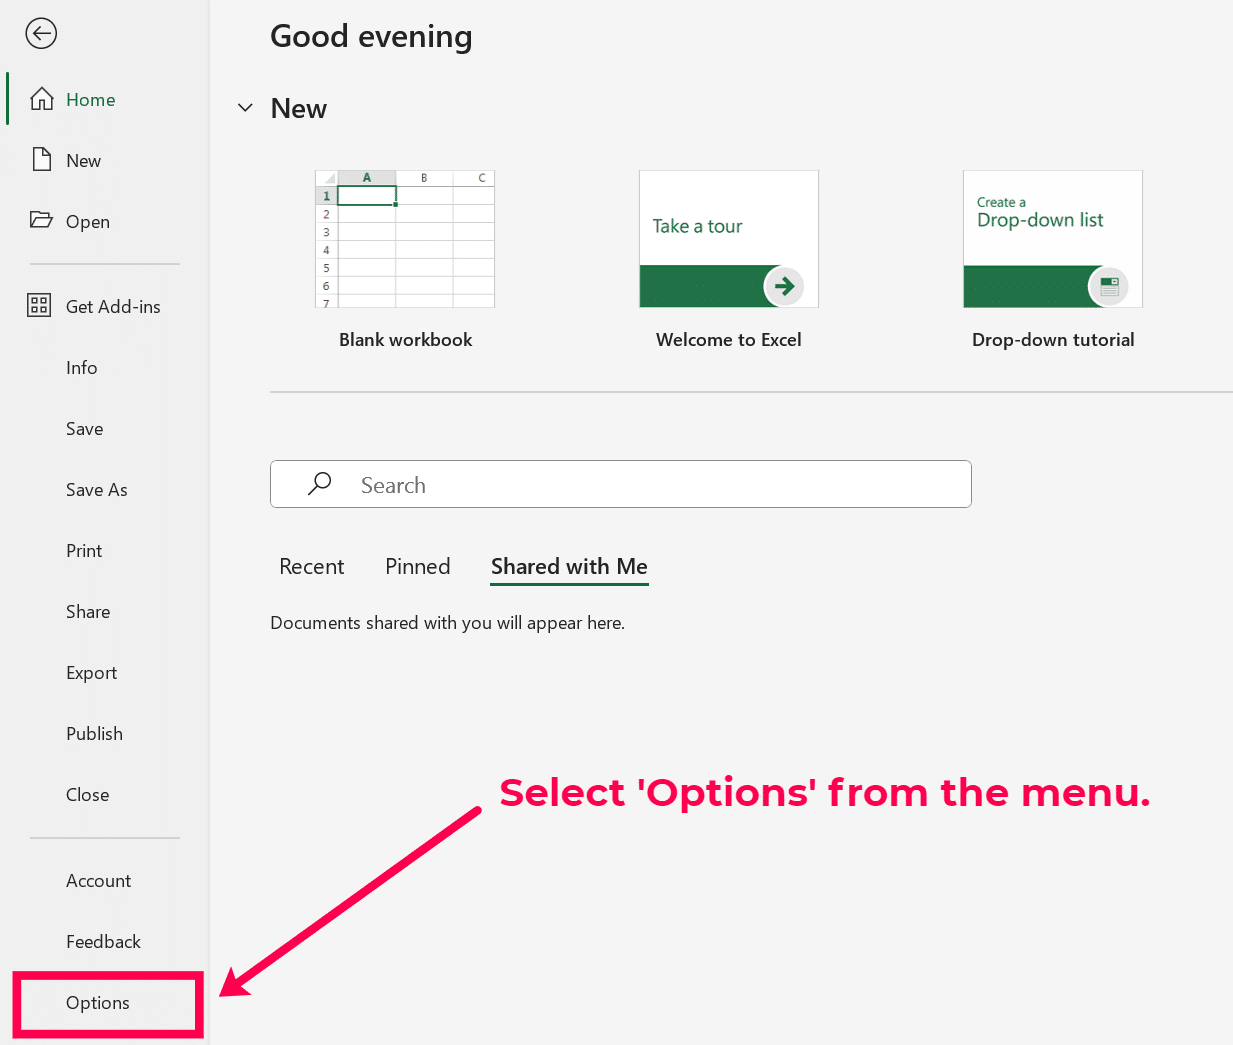
For Excel 2010 and later versions – Click on the ‘File’ tab in the top-left corner of the Excel window. Then select ‘Options’ from the menu on the left side. This action opens the Excel Options dialog box.
For Excel 2007 – Click on the Microsoft Office Button and then click ‘Excel Options’.
Step 2: Navigate to Add-Ins
In the Excel Options dialog box, select the ‘Add-Ins’ category on the left side. This section lists all available add-ins for Excel. At the bottom of the Add-Ins section, there is a manage field; ensure it reads ‘Excel Add-ins’ in the drop-down box next to ‘Manage’ and then click ‘Go…’. This will open the Add-Ins dialog box.

Step 3: Activate the Analysis ToolPak
In the Add-Ins dialog box, you will see a list of available add-ins. Locate ‘Analysis ToolPak’ in the list. Check the box next to ‘Analysis ToolPak‘ to select it. If you also need to perform complex statistical or engineering analyses, you might want to select ‘Analysis ToolPak – VBA‘ as well. Excel will now install the ToolPak, which might take a few moments. Once installed, it becomes available under the ‘Data’ tab in the ribbon, labeled as ‘Data Analysis’.

Common Issues While Installation
- ToolPak Does Not Appear –
Ensure that the add-in is not disabled. Go to ‘File’ > ‘Options’ > ‘Add-Ins’. At the bottom of the window, select ‘Disabled Items’ from the ‘Manage’ drop-down menu and click ‘Go’. If the Analysis ToolPak is listed, select it and click ‘Enable’.
Verify your Excel installation: The Analysis ToolPak is included in all versions of Excel but might not be installed by default, especially in custom installations. You might need to run the Excel or Office setup again and choose the option to install add-ins.
- Errors During Installation –
Check for updates: Ensure your version of Office is up-to-date as updates can fix bugs that might prevent add-ins from installing correctly. You can check for updates from within any Office application under ‘File’ > ‘Account’ > ‘Update Options’.
Repair Office: If updates do not resolve the issue, try repairing your Office installation. Go to Control Panel > Programs > Programs and Features, select your Microsoft Office installation, and click ‘Change’ then select ‘Repair’.
- Performance Issues Post Installation –
If Excel becomes unusually slow or crashes after installing the ToolPak, it might indicate conflicts with other add-ins or Excel itself. Consider starting Excel in Safe Mode (hold Ctrl while launching Excel) to check if the issue persists without any add-ins loaded.
By following these steps, you should be able to successfully install and start using the Analysis ToolPak in Excel for enhanced data analysis capabilities. Now, as we have installed the Analysis ToolPak, let us understand the features of the Analysis ToolPak.
Features of the Analysis ToolPak
The features of the Analysis ToolPak in Excel are as follows:
| Tool | Description | Application |
| Histograms | Generates a graphical representation of the frequency distribution of data. | Useful for visualizing data distribution, identifying central tendencies, and spotting outliers. |
| Descriptive Statistics | Provides key statistics like mean, median, mode, etc. | Essential for summarizing data sets to understand characteristics quickly. |
| t-Tests | Tests differences between means for paired or independent samples. | Used to compare measurements in controlled experiments or between two groups. |
| Analysis of Variance (ANOVA) | Tests differences between means of three or more groups. | Determines if there are significant differences between group means. |
| Regression Analysis | Provides tools to perform linear regression and forecasting. | Models relationships between variables and is useful in trend analysis and forecasting. |
| Correlation | Measures the degree of association between two variables. | Determines the strength and direction of a relationship between two variables. |
| Covariance | Evaluates the directional relationship between two variables. | Helps understand how two variables vary together. |
| Fourier Analysis | Transforms time series data into the frequency domain. | Used in signal processing and system analysis to identify periodicities in data. |
| Random Number Generation | Generates random numbers based on various statistical distributions. | Useful in simulations, Monte Carlo methods, and for creating test data. |
| Exponential Smoothing | A form of weighted moving average used for smoothing data series. | Used in forecasting to manage data volatility and identify trends. |
| F-Test | Compares statistical models to identify the best fit for the data. | Compares variances across samples and assesses the significance of predictors in regression. |
| Moving Average | Computes the moving average of a data set. | Helps identify trends in time series data by smoothing short-term fluctuations. |
Prepare the Data for Analysis in Excel
This section provides tips on how to effectively organize data, underscores the importance of data cleaning and validation, and highlights common mistakes to avoid.
Tips for Organizing Your Data in Excel
Tip 1: Structure Your Data Set
- Consistent Format – Ensure all data is formatted consistently (e.g., dates in one column should all follow the same format).
- Single Header Row – Use a single header row for column titles to avoid confusion and ensure that Excel recognizes these headers correctly.
- Data Types – Make sure data types are correct in each column (e.g., numbers, text, dates).
- Avoid Merging Cells – Merged cells can complicate analysis and should be avoided in the dataset you intend to analyze.
Tip 2: Use Tables
- Convert Ranges to Tables – Convert data ranges to Excel tables (using the Insert > Table feature) for better management and to enable the use of structured references.
- Table Benefits – Tables help in managing data, as they support dynamic ranges (expanding and contracting automatically as you add or remove data).
Tip 3: Use Descriptive Column Names
Use clear, descriptive column names without including spaces or special characters which might be interpreted incorrectly by Excel functions.
Common Mistakes to Avoid When Setting Up Data for Analysis
- Ignoring Blank Rows and Columns – Blank rows and columns can disrupt many of Excel’s data tools and functions. Ensure these are removed from your dataset.
- Using Inconsistent Data Types – Ensure all data in each column is of the same type. Mixing numbers and text, for example, can cause errors during analysis.
- Neglecting to Freeze Panes – When working with large datasets, use the ‘Freeze Panes’ feature to keep header rows and key columns in view.
Example Dataset
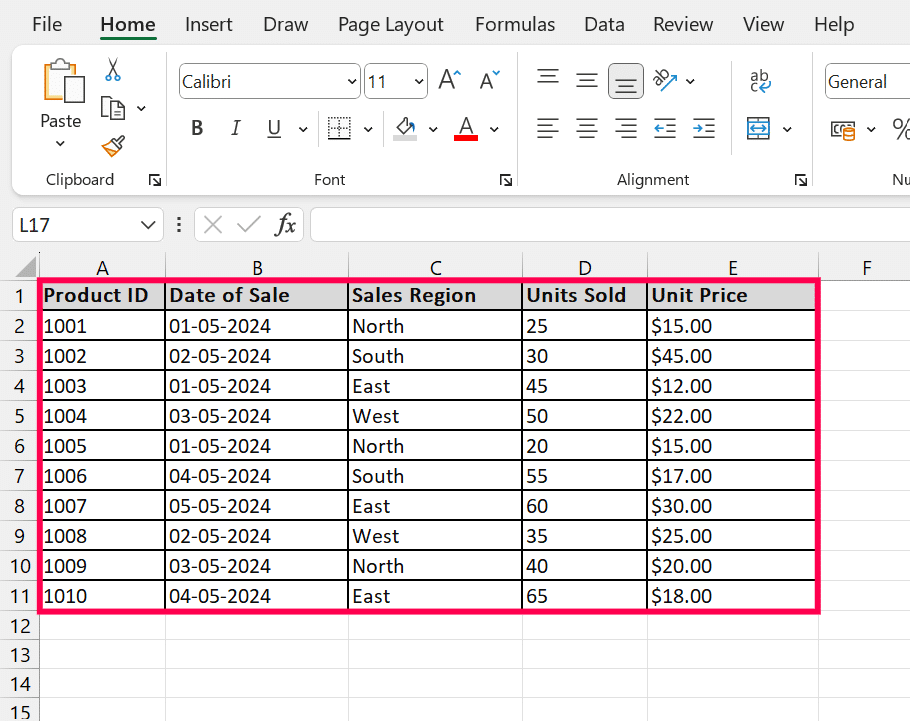
This dataset follows the guidelines of consistency, use of tables, clear column names, and correct data formats. It is ready for further analysis using Excel’s Analysis ToolPak.
Use the ToolPak for Statistical Analysis
Analyzing data with the Analysis ToolPak in Excel involves several steps, from selecting the appropriate tools to interpreting the results accurately. Here’s a detailed guide to using the ToolPak for statistical analysis, with specific examples from the dataset provided.
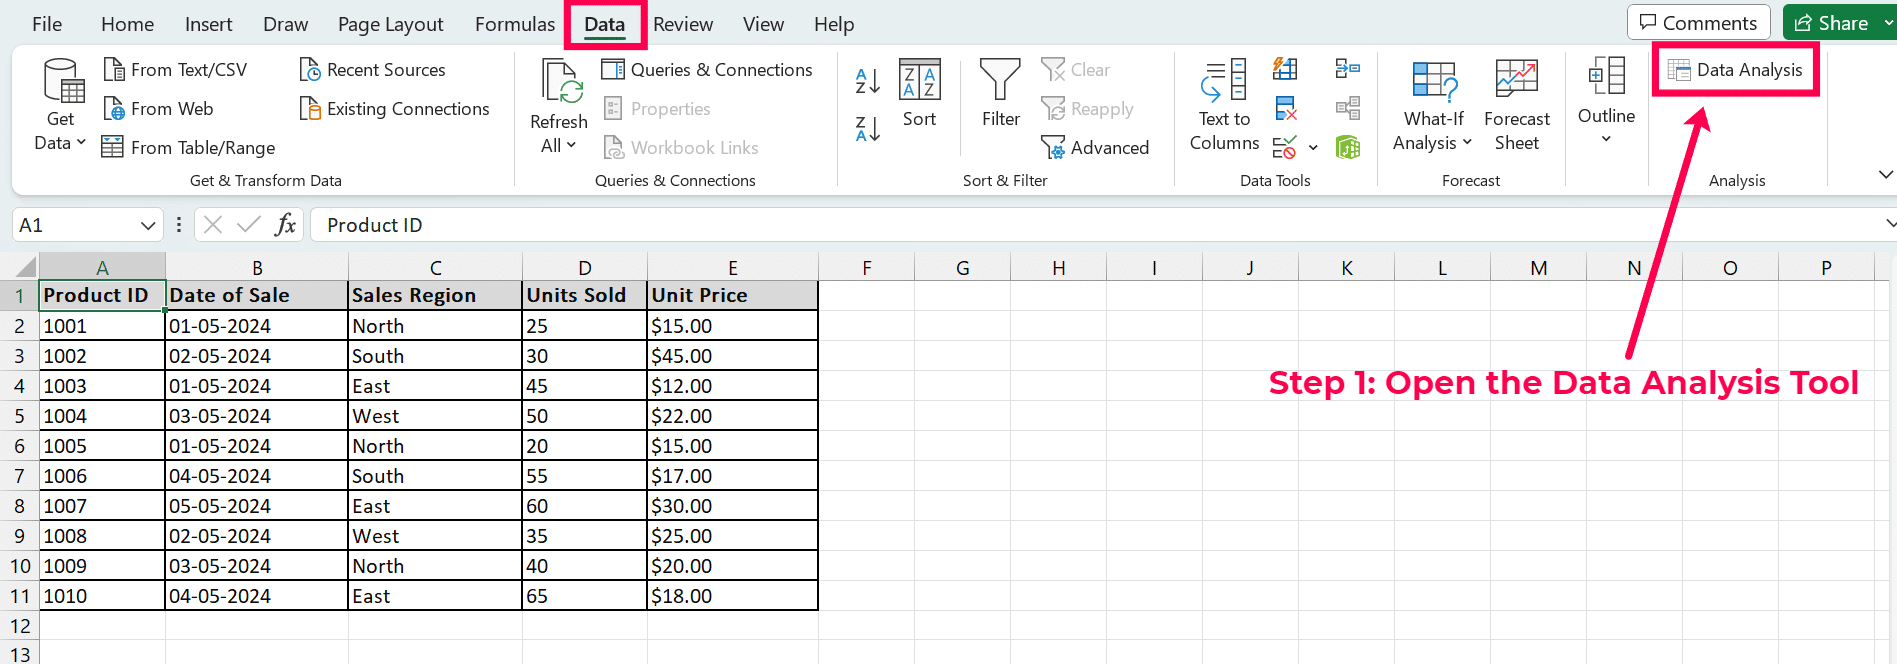
Step 1: Open the Data Analysis Tool
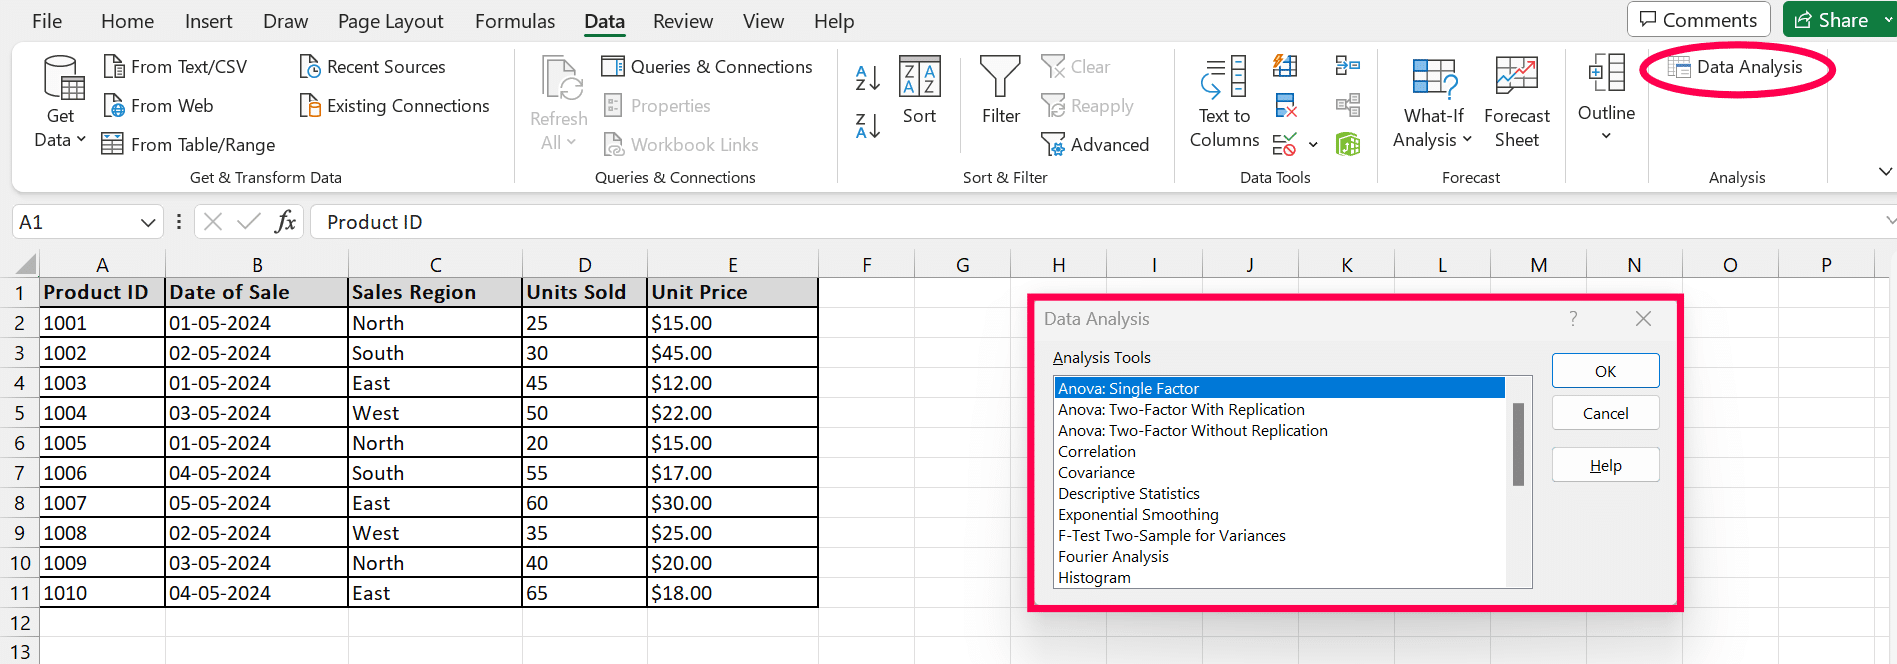
Once the ToolPak is enabled, access it by clicking on ‘Data’ on the Ribbon, then select ‘Data Analysis’ on the far right of the toolbar.
Step 2: Input the Required Data Ranges and Parameters
Enter the appropriate input range for your data. For example, if performing an ANOVA, select all data points across different categories (e.g., Units Sold in different Sales Regions). Set any additional parameters required by the specific tool, such as grouping variables or significance levels.
Step 3: Conduct and Interpret Outputs from Various Statistical Tests
Here, we’ll cover several statistical methods available in the ToolPak:
Descriptive Statistics:
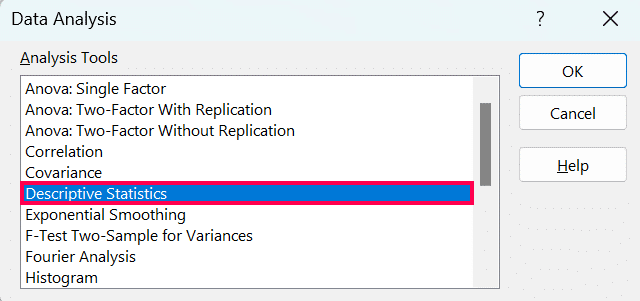
This Provides basic statistics like mean, median, mode, standard deviation, etc. Select ‘Descriptive Statistics‘ from the menu.
Then, select the input range of ‘Units Sold‘, select ‘Labels in First Row’ because we have titles and choose the output options. Also, select ‘Summary Statistics’.
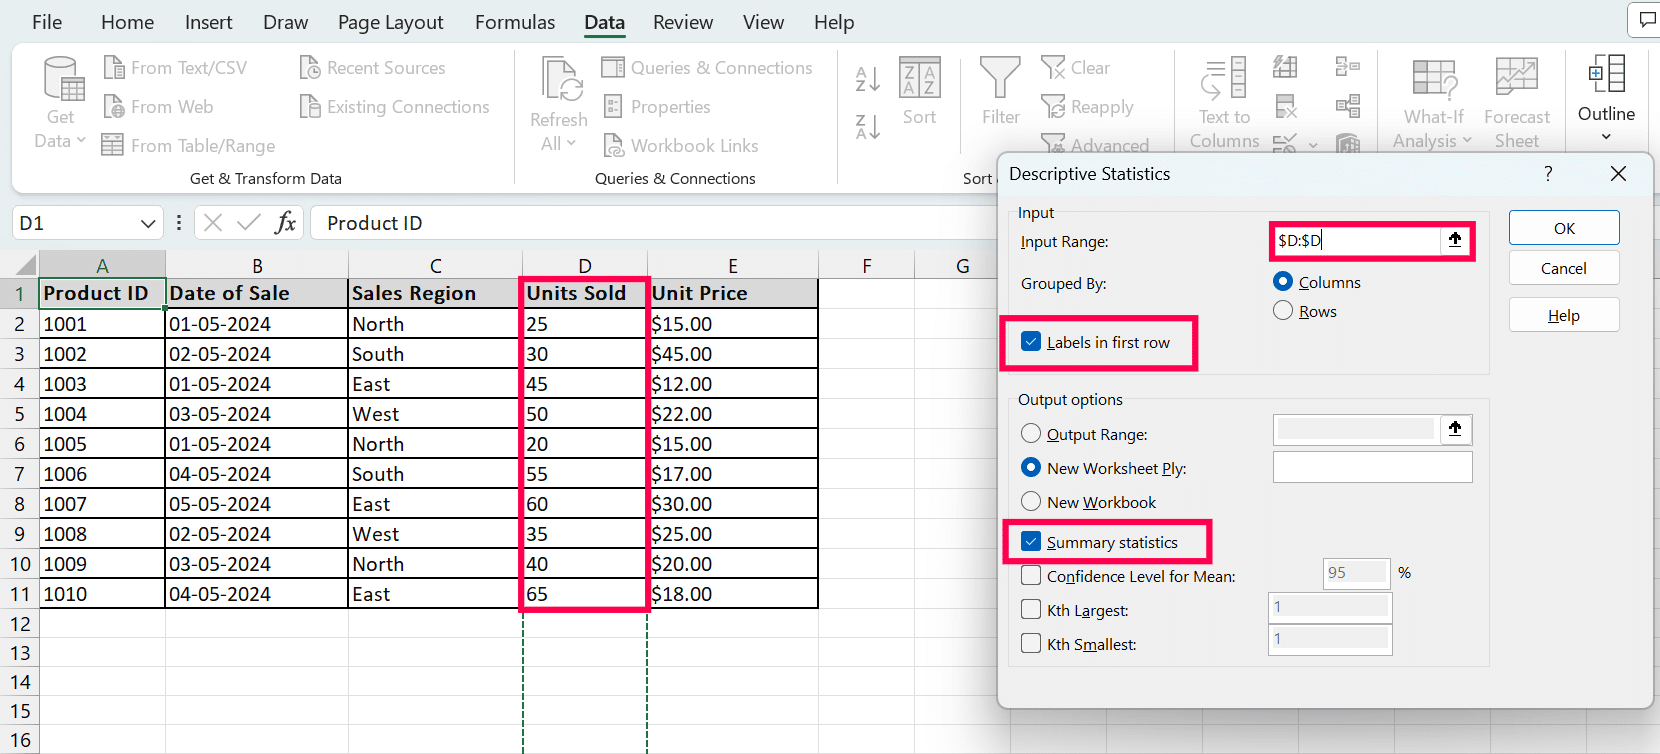
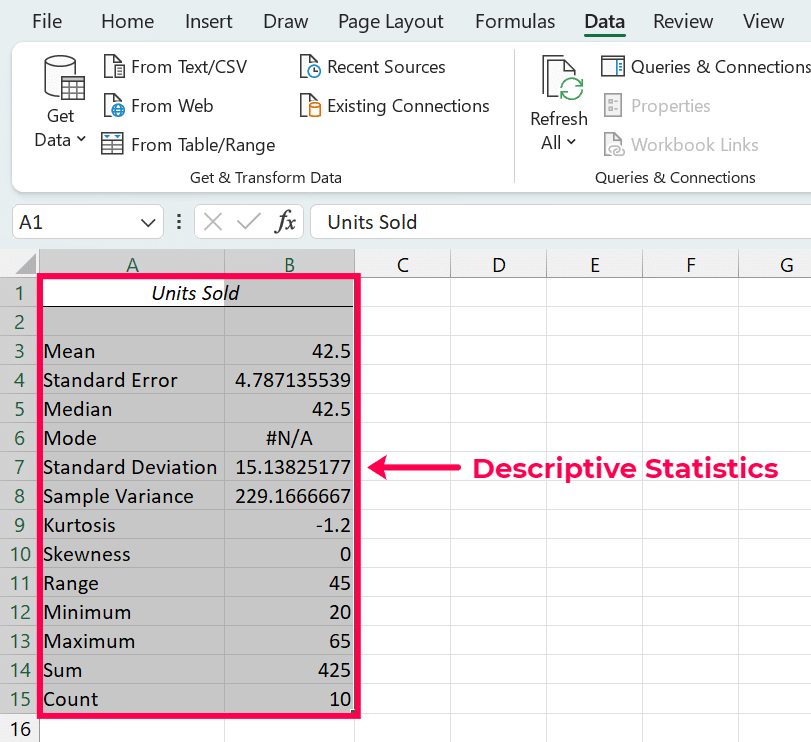
The output will give you a summary of the data, including central tendency and variability, which helps in understanding the distribution and scale of sales data.
ANOVA (Analysis of Variance):

Stop exporting data manually. Sync data from your business systems into Google Sheets or Excel with Coefficient and set it on a refresh schedule.
Get Started
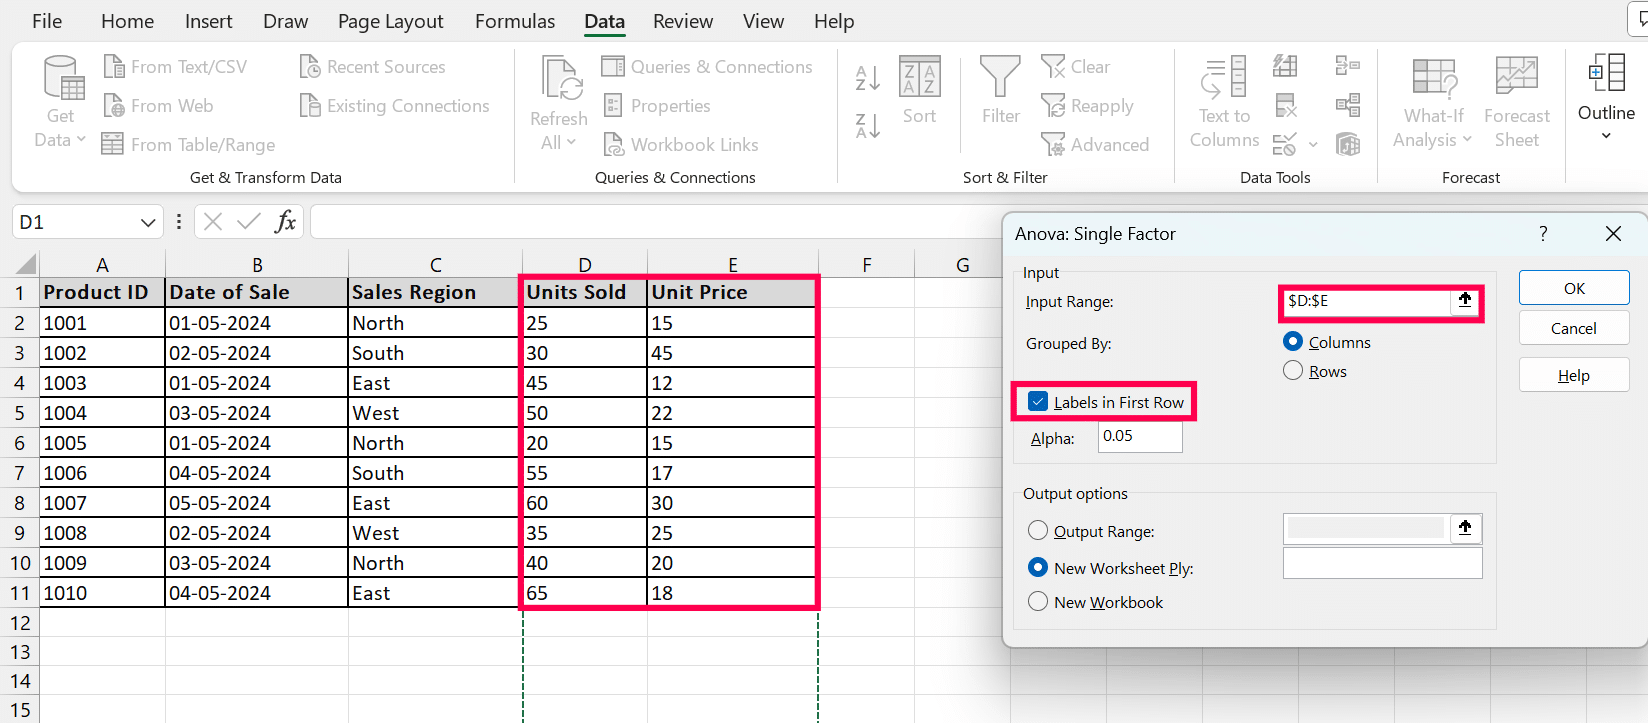
This compares means across multiple groups to see if at least one differs significantly. Choose ‘ANOVA: Single Factor‘.

Then, input the range for ‘Units Sold‘ grouped by ‘Unit Price‘(removed $ symbol because it doesn’t run with non-numeric data), then select ‘Labels in First Row’ because we have titles and choose the output options.
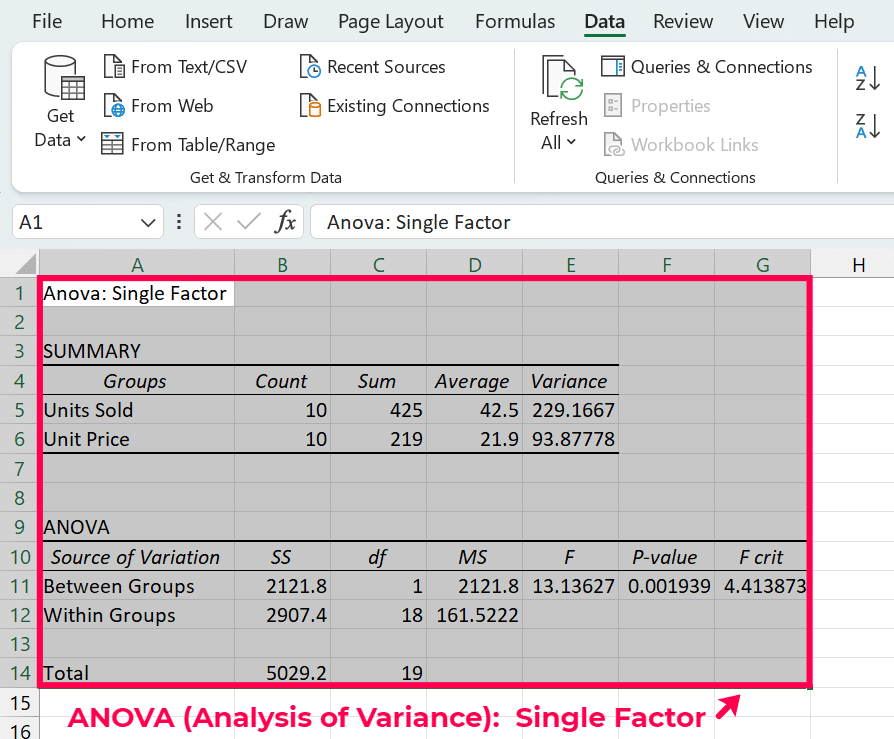
The output includes the F-statistic and p-values. A significant p-value (typically <0.05) indicates significant differences between regions.
F-Test:
This compares variances of two datasets to test if they come from populations with equal variances. Select ‘F-Test Two-Sample for Variances’, input the data ranges for two regions. A significant result suggests a difference in the variability of sales between the two regions.
Regression Analysis:
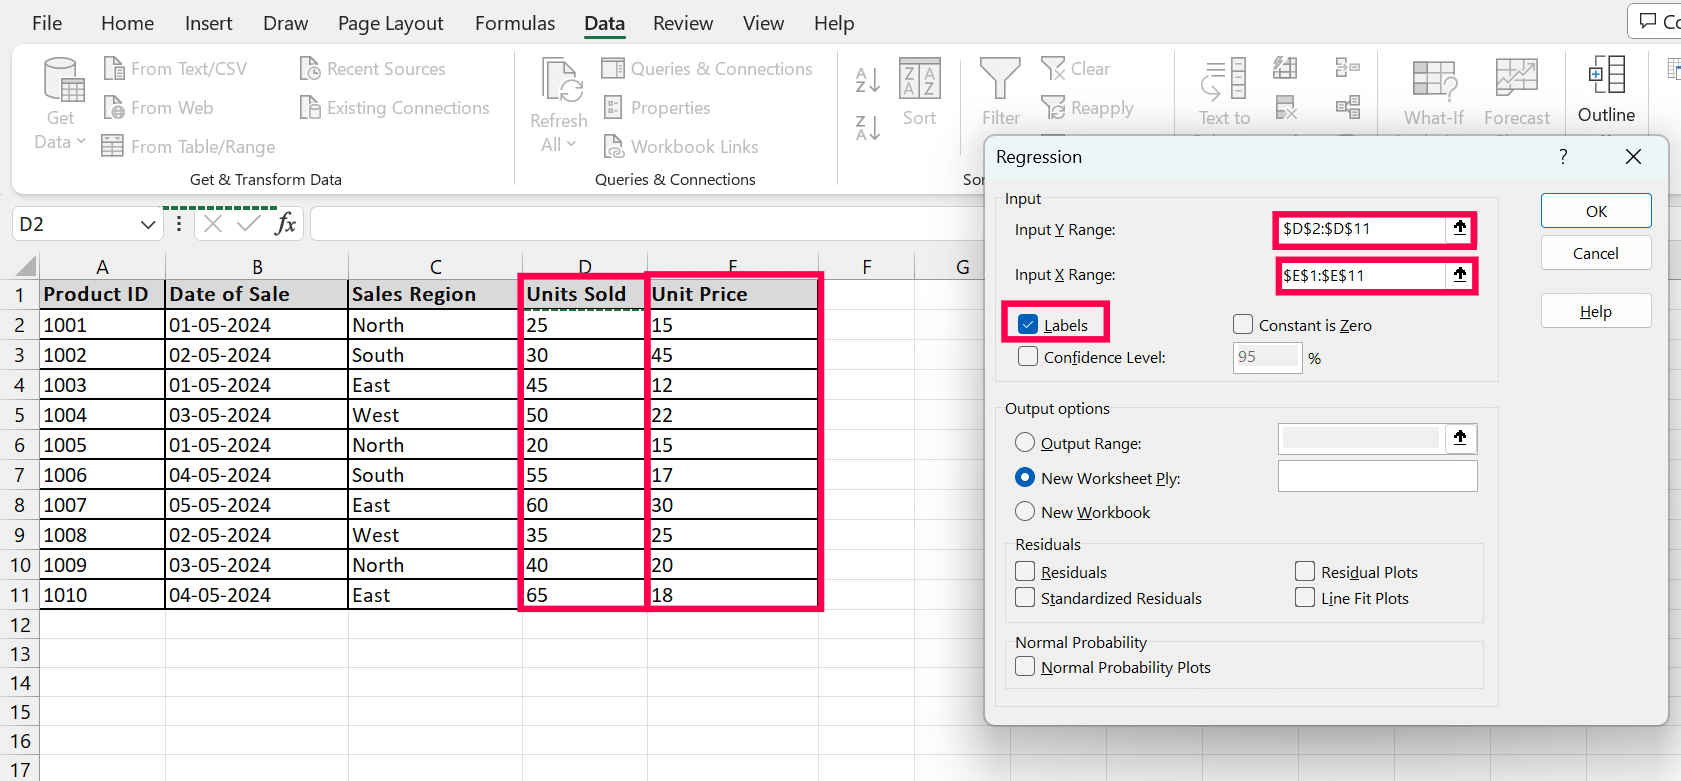
Determines the relationships between variables, such as predicting sales based on price or regional factors. Now, Choose ‘Regression’.

Then, define ‘Units Sold‘ as the dependent variable, and ‘Unit Price‘ (removed $ symbol because it doesn’t run with non-numeric data) as the independent variable. Also, select ‘Labels’.
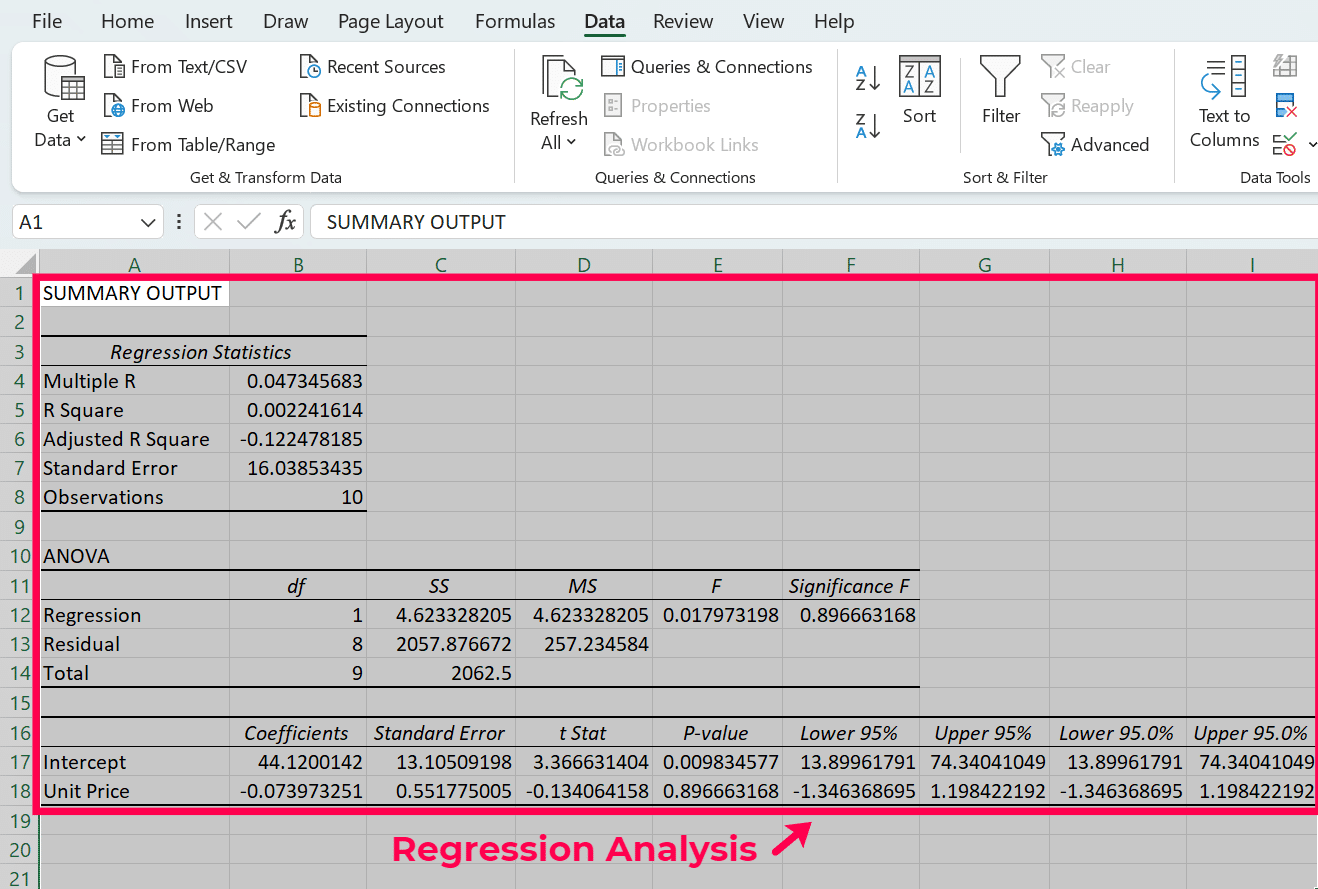
The output provides regression coefficients, R-square, and p-values for each predictor. Coefficients indicate the expected change in the dependent variable for one unit of change in the predictor, while the R-square shows how well data fit the regression model.
Looking to streamline your data analysis processes in Excel? Discover how Coefficient can enhance your Data Analysis ToolPak experience. With its one-click data connection and automatic refresh features, you can seamlessly integrate real-time data into your analyses. Try Coefficient for free and revolutionize your spreadsheet data management and analysis today.
Advanced Data Analysis Techniques
Explore More Complex Functions Like Correlation and Covariance
- Correlation Analysis – Correlation analysis is used to measure the relationship between two variables. It identifies how closely changes in one variable are related to changes in another. In Excel’s Analysis ToolPak, users can calculate the correlation coefficient that ranges from -1 to 1. This helps in understanding the strength and direction of the relationship, it is crucial for strategic decisions in areas like finance and product development.
- Covariance Analysis – Covariance helps determine how two variables move together, providing insights into how they are related. It is especially useful in finance for risk management and portfolio diversification. The Analysis ToolPak enables users to calculate covariance, offering a deeper look into the dynamics between different market variables or consumer behavior trends.
- Regression Analysis – Regression analysis is an effective statistical tool that helps to investigate the connection between two or more variables. It is useful in estimating the value of a dependent variable given the value of one or more independent variables. This technique is commonly applied for forecasting and trend analysis to help businesses make decisions based on the forecasted results.
- Analysis of Variance (ANOVA) – ANOVA is a statistical method that is used to compare the means of three or more samples in order to determine whether at least one of the sample means is significantly different from the others. This technique is very useful in hypothesis testing and finding differences between data sets, which makes it applicable in quality assurance, product development, and scientific investigations.
- Principal Component Analysis (PCA): Curtail the depth of large sets of data while conserving as much contention as possible. It is used in image condensing, genome data analysis, and to simplify models by curtailing the number of variables. For Example: reducing a dataset of 100 attributes to a few principal components that elucidate most of the variance.
- Time Series Analysis: Dissect time-ordered data points to extract significant statistics and features. It indulges techniques like ARIMA (Auto-Regressive Integrated Moving Average), Exponential Smoothing, and Seasonal fermentation. For example: Using ARIMA to forecast future sales based on past sales data.
- Cluster Analysis: Cluster a set of objects in such a way that objects in the same assembly are more similar to each other than to those in other groups. K-means clustering, Hierarchical clustering, DBSCAN (Density-Based Spatial Clustering of Applications with Noise). For example: Partitioning customers into different groups based on buying behavior.
Integrate Analysis ToolPak with Other Excel Features
Integrate Analysis ToolPak with PivotTables
PivotTables allow users to quickly summarize large datasets. By using the Analysis ToolPak, you can perform complex analyses on summarized data such as regression analysis or correlation.
Steps to Integrate –
- First, create a PivotTable as usual with your dataset.
- Then, use the summarized data as input for ToolPak functions. For instance, you might run a regression analysis on sales data aggregated by month or region.
Integrate Analysis ToolPak with Conditional Formatting
Conditional Formatting can be used to dynamically format cells in a spreadsheet that meet certain criteria based on the statistical results obtained from the Analysis ToolPak. After performing a statistical test like t-test or ANOVA, use Conditional Formatting to highlight significant p-values (e.g., those less than 0.05) to quickly visualize and interpret areas of significance in your data.
Automate Repetitive Tasks Using Macros with ToolPak Functions
You can automate repetitive data analysis tasks by creating macros that utilize ToolPak functions.
Steps to Automate –
1. Record a macro where you set up and run a specific ToolPak function, such as a histogram or regression analysis.
2. Modify the macro in VBA to loop through different data sets or parameters, applying the same analysis repeatedly.
By integrating the Analysis ToolPak with other Excel features like PivotTables and Conditional Formatting, and automating repetitive tasks through macros, users can enhance their data analysis capabilities significantly. These integrations not only save time but also bring depth to the data analysis process, making insights easier to understand and visually more impactful.
Pro Tips on Overall Use of Analysis ToolPak
- Before using the ToolPak, make sure your data is compatible and adequately formatted—numeric data should be free of text, and missing values should be handled appropriately.
- Ensure the ToolPak is enabled before starting your analysis, as it is not turned on by default in Excel.
- Make use of the Help files associated with the Analysis ToolPak for guidance on using various tools. Each function in the ToolPak comes with a detailed Help section.
- Always make a backup of your data before you try to perform any complicated analysis in order to prevent loss or corruption of data.
- To get a feel of the different tools in the Analysis ToolPak, practice using them on different sample data sets to see how they work and where they can be useful.
- Clean and arrange your data carefully. Remove duplicates, manage missing values, and ensure data coherence. High-quality data is critical for precise scrutiny and dependable outcomes.
- Use detailed statistics to get a beginning sense of your data. Measures like Mean, median, standard deviation, and range offer perceptions into the data’s central proneness and variability. This step is base before moving to more intricate analysis.
- Analysis of Variance (ANOVA) is crucial when comparing means across multiple groups. It’s specifically useful in analysis designs to recognize if there are substantial distinctions between group means.
Application Example of Analysis ToolPak
The Analysis ToolPak in Excel is an add-on for complex statistical and engineering analyses. A typical real-world application is inventory management in the retail industry. Retailers can use the ToolPak to analyze sales data and predict inventory requirements. By employing regression analysis, a business can forecast future demand based on historical sales data, seasonal trends, and promotional activities. This predictive capability enables efficient stock management, reducing overstock and stockouts and improving cash flow.
Case studies showing practical applications of Analysis ToolPak are below:
- Marketing Effectiveness: A digital marketing agency uses the Analysis ToolPak to evaluate the effectiveness of different advertising campaigns. By conducting hypothesis testing and variance analysis, the agency will be able to determine the campaigns that significantly increased traffic and conversions. This helpes in reallocating budgets to the most effective channels.
- Financial Modeling: A financial consultant uses the ToolPak for risk analysis in investment portfolios. By applying ToolPak’s correlation and regression tools, the consultant assesses the risk associated with different asset classes and strategies to mitigate volatility while maximizing returns.
- Operational Efficiency: A manufacturing company applies ToolPak’s descriptive statistics tools to measure production line efficiency. By analyzing the mean, median, and mode of production times, the company will be able to identify bottlenecks and implement process improvements that enhance throughput.
While the Analysis ToolPak is powerful for statistical analysis, it requires data to be manually prepared and imported into Excel. This is where the Coefficient can significantly enhance the efficiency and accuracy of using the Analysis ToolPak. Coefficient automates the data import process from various sources like Salesforce, MySQL, and others directly into Excel, ensuring that the data needed for analysis is up-to-date and accurately reflected.
Businesses and analysts can achieve more accurate forecasts, deeper insights, and strategic decision-making by leveraging both tools. Exploring Coefficient‘s capabilities would be a worthwhile investment for those looking to maximize their use of Excel for complex data analysis.


