The coefficient of variation (CV) tells you how spread out your data is compared to its average. Whether you’re comparing investment risks or analyzing lab results, CV gives you a clear way to measure and compare variability across different data sets.
Let’s walk through exactly how to calculate CV, interpret the results, and apply this knowledge to real situations.
How to Calculate the Coefficient of Variation
The coefficient of variation is the standard deviation divided by the mean, then multiplied by 100 to get a percentage. Here’s a step-by-step breakdown:
- Calculate the mean
- Add all values in your dataset
- Divide by the number of values
- Find the standard deviation
- Calculate how far each value is from the mean
- Square these differences
- Find their average
- Take the square root
- Apply the CV formula
- Divide standard deviation by mean
- Multiply by 100 for percentage
Let’s work through an example using monthly sales data:
|
Month |
Sales ($) |
|---|---|
|
Jan |
50,000 |
|
Feb |
45,000 |
|
Mar |
55,000 |
|
Apr |
48,000 |
|
May |
52,000 |
Step 1: Mean = $50,000 Step 2: Standard Deviation = $3,808 Step 3: CV = (3,808 ÷ 50,000) × 100 = 7.62%
Using Excel for CV Calculations (2025 Method)
Excel makes CV calculations straightforward. Here’s how:
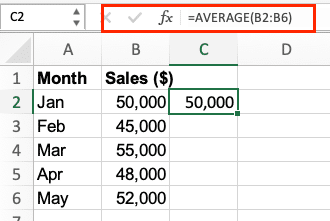
- Calculate Mean
=AVERAGE(range)
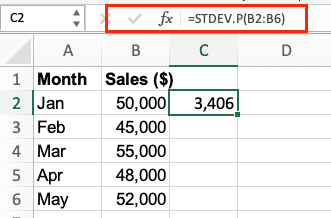
- Calculate Standard Deviation
=STDEV.P(range)
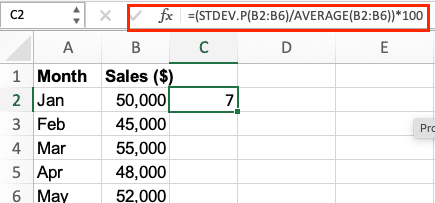
- Get CV
=(STDEV.P(range)/AVERAGE(range))*100
Pro Tip: Create a reusable template by naming your data range and referring to it in your formulas.
What Does a Coefficient of Variation Tell You?
The CV value reveals the relative variability in your data. Here’s what different values mean:
CV < 1 (or < 100%)
- Data shows low variability
- Values cluster close to the mean
- Generally indicates consistency
CV > 1 (or > 100%)

Stop exporting data manually. Sync data from your business systems into Google Sheets or Excel with Coefficient and set it on a refresh schedule.
Get Started
- High variability
- Values spread far from mean
- May signal volatility or inconsistency
Practical Applications Across Fields
Finance:
- Compare risk levels between investments
- Assess stock price volatility
- Evaluate portfolio performance
Manufacturing:
- Monitor product specifications
- Check process consistency
- Set quality control limits
Research:
- Compare measurement methods
- Validate experimental results
- Assess data reliability
CV Values and Their Significance
Different fields have different CV standards:
|
Field |
Acceptable CV Range |
|---|---|
|
Manufacturing |
2-5% |
|
Lab Testing |
5-10% |
|
Biology |
10-15% |
|
Social Science |
15-30% |
Common CV Analysis Scenarios
Portfolio Analysis:
- Compare different investment strategies
- Evaluate risk-adjusted returns
- Assess fund manager performance
Quality Control:
- Monitor production line output
- Track measurement precision
- Set control limits
Next Steps
Ready to enhance your data analysis capabilities? Try Coefficient to connect your business data directly to spreadsheets. Get started with Coefficient and transform how you work with data.


