
Measuring the right customer service metrics is critical for understanding your support team’s performance, identifying areas for improvement, and delivering the high-quality service your customers expect. But with data often fragmented across platforms, many leaders struggle to get a clear, real-time view of their key metrics.
According to a Microsoft report, 90% of customers say customer service is important in their choice of and loyalty to a brand, underscoring the importance of optimizing your support operations through data-driven decision-making.
In this post, we’ll share the 5 most important customer service metrics to track, along with templates to streamline your reporting.
1. Ticket Volume by Priority Level & Channel
Keeping a pulse on the volume and distribution of your support tickets is essential for resource planning, identifying spikes, and ensuring speedy responses. By monitoring ticket volume by priority level and channel, you can:
- Allocate staff to meet demand across channels
- Triage and respond to high-priority issues rapidly
- Spot ticket surge trends and prepare proactively
How to Calculate Ticket Volume by Priority & Channel
Calculate total tickets and segment by priority (e.g. urgent, high, medium, low) and channel (e.g. phone, email, chat, social). Track volume over time.
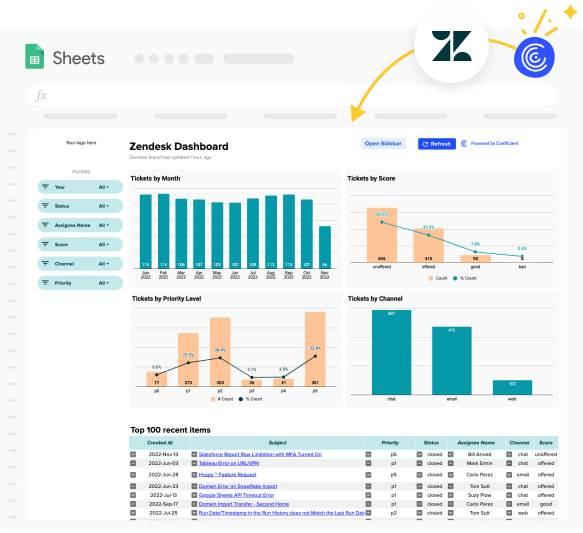
Coefficient’s Zendesk Tickets Dashboard Template
Coefficient’s Zendesk Tickets Dashboard Template empowers you to:
- Automatically pull in live data from Zendesk
- See tickets by priority, channel, and status at a glance
- Identify response and resolution time trends
- Pinpoint agents who may need coaching
With this template, you’ll gain an instant, automatic view of your ticket pipeline so you can keep your team humming.
2. Net Promoter Score (NPS)
Your Net Promoter Score indicates how likely your customers are to recommend you, serving as a crucial barometer for loyalty and satisfaction. By religiously tracking NPS, you can:
- Gauge customer sentiment over time
- Benchmark performance against industry averages
- Identify your biggest promoters and detractors
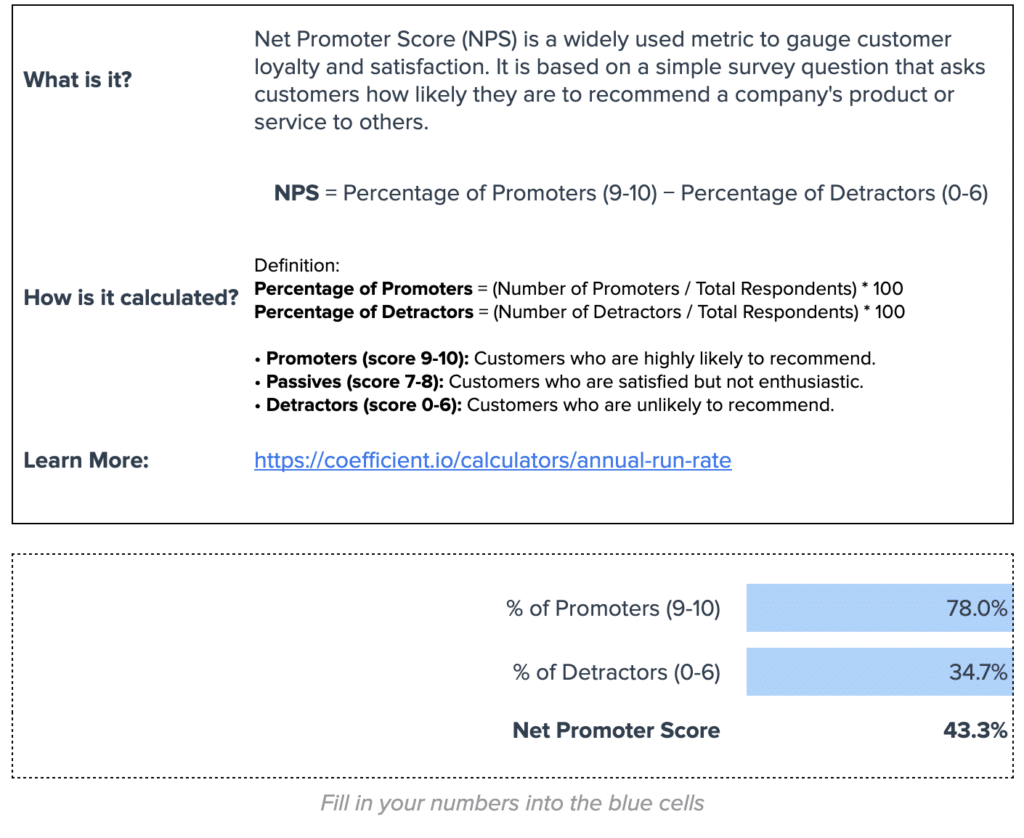
How to Calculate NPS
NPS is calculated by subtracting the % of detractors (scores 0-6) from the % of promoters (scores 9-10) on a 0-10 point scale asking customers how likely they are to recommend you.
Coefficient’s NPS Survey Template
Coefficient’s NPS Survey Template makes tracking this critical metric a breeze:
- Automatically calculates your NPS based on survey responses
- Segments promoters, passives, and detractors
- Shows NPS trends over time
- Helps you quickly spot and act on dips or negative feedback
NPS is notoriously time-consuming to track manually. Put it on autopilot with Coefficient’s plug-and-play template.
3. Customer Retention Rate
Retaining happy customers is the lifeblood of any business. Your customer retention rate shows how well you’re hanging onto customers over time. By monitoring retention, you can:
- See how many customers are sticking with you
- Predict future revenue based on cohort retention
- Identify churn risks and proactively intervene
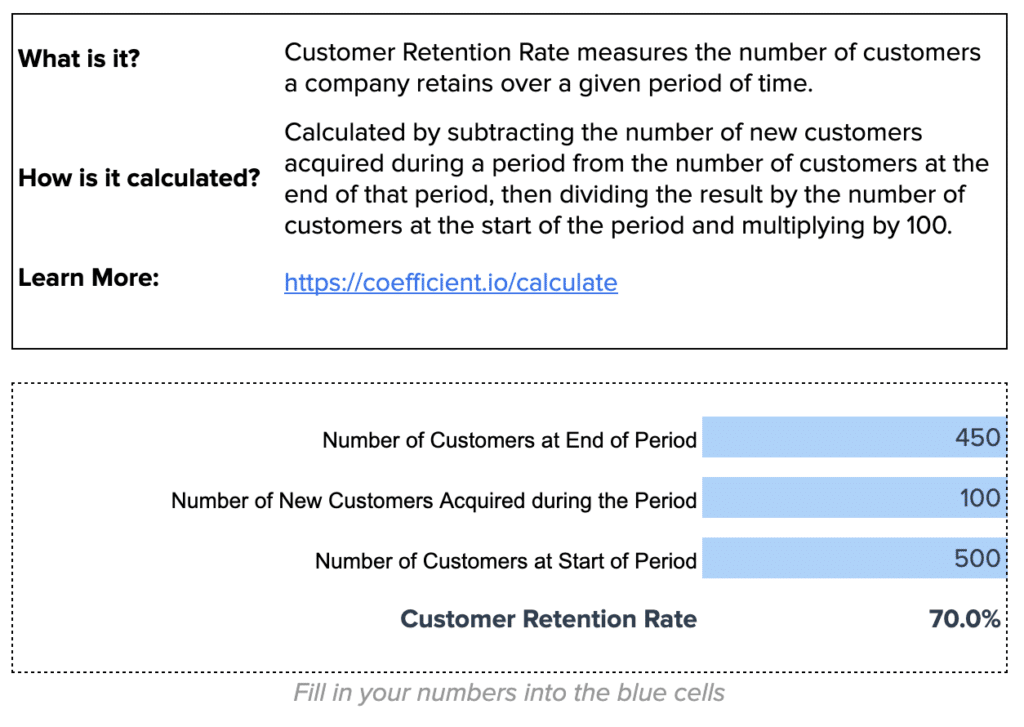
How to Calculate Customer Retention Rate
Customer retention rate is calculated by dividing your # of active customers at the end of a period by the # of active customers at the start of that period (not counting new customers added).
Coefficient’s Customer Retention Template
Coefficient’s Customer Retention Template empowers you to:
- Automatically calculate retention rate
- Track retention rate trends over time
- Forecast future retention based on past cohort behavior
- Benchmark retention vs churn
Measuring retention manually in spreadsheets is a recipe for human error. Keep your data clean and current with Coefficient’s template.
4. Expansion Revenue
While keeping existing customers is crucial, true growth comes from expanding those relationships over time. Expansion revenue refers to the additional revenue generated from existing customers through upsells, cross-sells, and add-ons. By tracking expansion revenue, you can:

Stop exporting data manually. Sync data from your business systems into Google Sheets or Excel with Coefficient and set it on a refresh schedule.
Get Started
- Identify accounts primed for growth
- Measure the impact of customer success efforts on revenue
- Incentivize support teams to spot expansion opportunities
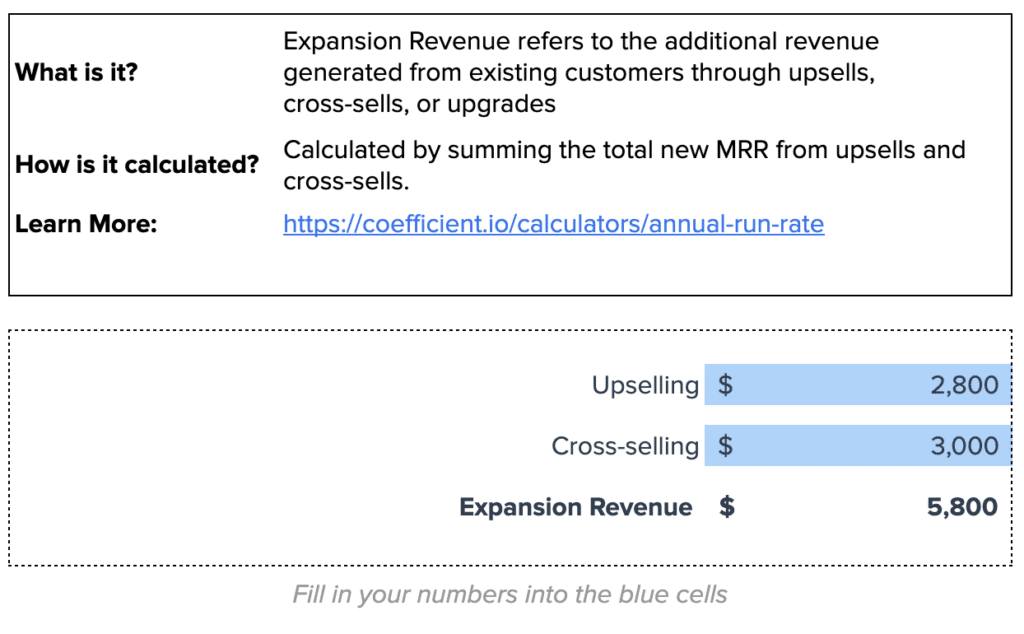
How to Calculate Expansion Revenue
Calculate expansion revenue by totaling the additional revenue generated from existing customers over a given time period.
Coefficient’s Expansion Revenue Template
Coefficient’s Expansion Revenue Template enables you to:
- Automatically track expansion revenue from Salesforce data
- Measure expansion revenue by account and cohort
- Identify top expansion opportunities
- Pave the way for smooth handoffs between support and sales
Many support teams lack visibility into expansion impact. Give your team a real-time view with Coefficient’s template.
Real-Time Data Changed the Game for Jebbit
Jebbit, a zero-party data platform, understands the challenges of cobbling together customer data. Before Coefficient, they grappled with:
- Fragmented data stuck in siloed tools
- Hours wasted on manual reporting
- Lack of visibility into key metrics
- Inability to forecast or course-correct accurately
By integrating their CRM and billing data with Coefficient’s templates, Jebbit achieved:
- Real-time visibility into sales commissions and pipeline
- Hours saved on manual data wrangling and calculations
- Trustworthy, up-to-date data and reporting
- Ability to provide metrics to execs on-demand
“Coefficient saved us hours upon hours of work. There’s no manual back-and-forth with salespeople about commissions anymore. But we haven’t just saved tons of time. We’ve also been able to offer our team better data and more transparency.” Rachel Golden, VP of Finance, Jebbit
Start Tracking the Metrics That Matter Most
Delivering exceptional customer service starts with measuring what matters. By tracking these 4 key metrics with Coefficient’s templates, you can keep a real-time pulse on performance while saving serious time on manual data and calculations.
Coefficient’s templates make it easy to centralize your most important customer service metrics in one place, with live data from your favorite tools. Instead of getting bogged down in data minutiae, you can focus on supporting your team, serving your customers, and driving the business forward.
Ready to take your customer service to the next level? Start tracking your metrics with Coefficient.


