You need to connect Excel API to import live data from any source into your workbooks. Manual data exports and copy-pasting waste time and leave your spreadsheets with outdated information.
This guide covers two proven methods to connect APIs to Excel. You’ll see how to automate data imports so your spreadsheets stay current without manual work.
Top 2 methods to connect any API to Excel
Transform your Excel workbooks into dynamic data dashboards with these proven approaches:
- Coefficient – No-code Excel add-in that connects any API with automatic refreshing and real-time synchronization
- Excel Power Query – Microsoft’s built-in data connection tool for custom API imports with advanced transformation capabilities
#1 Coefficient

Coefficient is an Excel add-in that connects your workbooks to live data from 70+ business systems and APIs without requiring any coding skills. Instead of wrestling with complex formulas or manual data imports, Coefficient provides a simple interface that transforms any REST API into a reliable data pipeline for your Excel dashboards.
Why Coefficient simplifies API connections:
- Works in Excel desktop and web – Full compatibility across all Excel versions and platforms
- Real-time data sync – Automatic refreshes ensure your workbooks always show current data
- Enterprise security – Direct API-to-Excel connection with no intermediate data storage
- Built for business users – Sales, finance, and marketing teams use it daily without IT involvement
How to connect any API in 4 simple steps:
Step 1. Install Coefficient and access the Connect Any API feature.
Visit the Microsoft AppSource store or coefficient.io to install the Excel add-in. Once installed, open Excel and click the Coefficient tab in your ribbon, then select “Import Data” and choose “Connect Any API.”
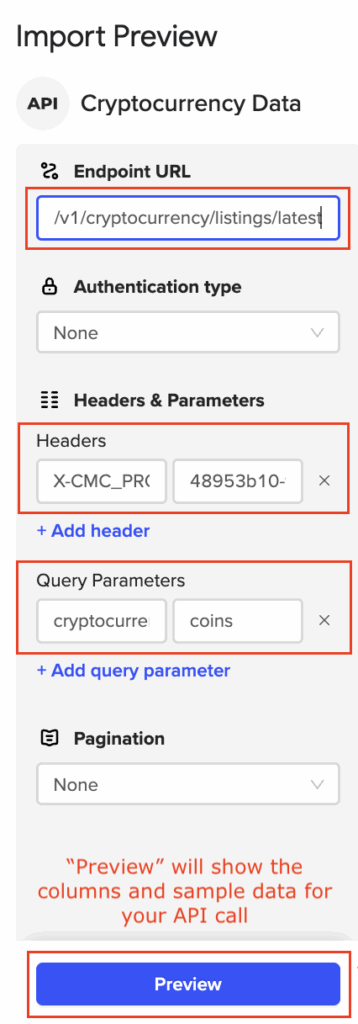
Step 2. Configure your API connection through the visual interface.
Enter your complete API endpoint URL in the provided field (e.g., https://api.yourservice.com/v1/data). Choose your authentication method from the dropdown menu (Bearer Token, API Key, Username/Password, or None) and add the required credentials.
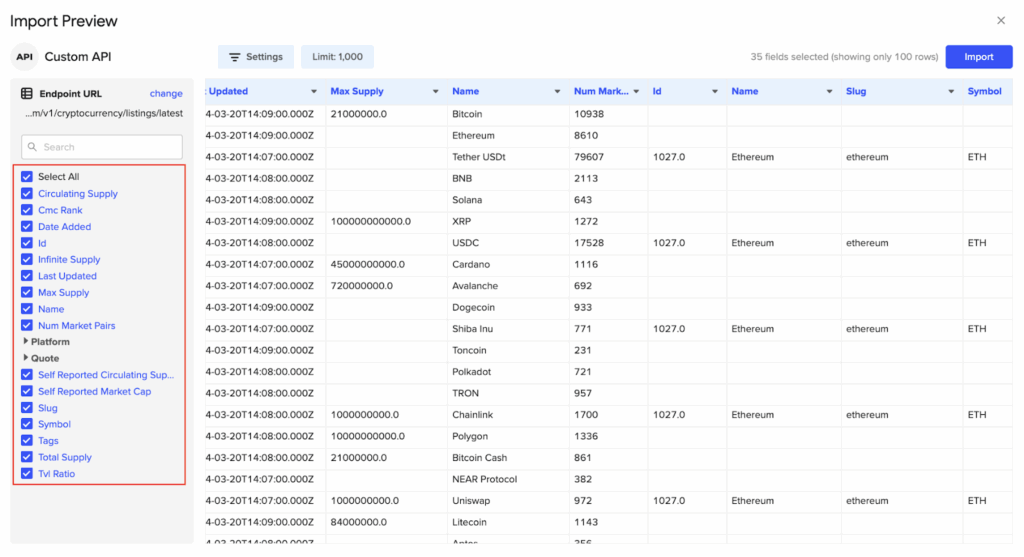
Step 3. Preview and select your data fields.
Coefficient automatically fetches a sample of your API response and displays the first 100 rows in a preview window. Check the boxes next to the columns you want to import and adjust any settings like row limits or response data nodes.
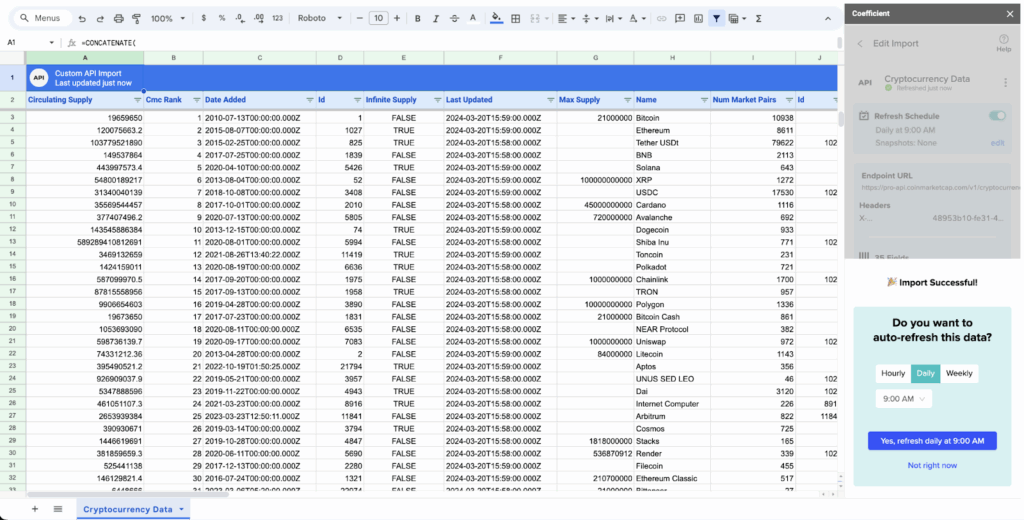
Step 4. Import data and enable automation.
Click the “Import” button to bring your API data directly into your Excel worksheet. Set up automatic refresh schedules (hourly, daily, or weekly) to keep your data current without any manual work.
Method 2: Excel Power Query
Excel Power Query is Microsoft’s built-in data connectivity and transformation engine that comes free with every Excel installation.
It allows you to connect directly to REST APIs, transform complex data structures, and create refreshable data connections that update your workbooks with the latest information from external sources.
When to choose Power Query:
- You need advanced data transformations before importing (filtering, splitting, combining columns)
- Your API returns nested JSON structures that require flattening
- You want complete control over data formatting and table structure
- You’re working with APIs that require complex authentication workflows
Manual setup process:

Stop exporting data manually. Sync data from your business systems into Google Sheets or Excel with Coefficient and set it on a refresh schedule.
Get Started
Step 1. Access Power Query from Excel’s Data tab.
Open your Excel workbook and navigate to the Data tab in the ribbon. Click “Get Data” → “From Other Sources” → “From Web” to open the web data connection dialog.
Step 2. Enter your API endpoint and authentication details.
Paste your complete API URL into the dialog box, including any required API keys in the URL parameters (e.g., ?api_key=YOUR_KEY). Choose the appropriate authentication method: Anonymous for public APIs, Basic for username/password, or Web API Key for token-based authentication.
Step 3. Navigate and transform your API response data.
Power Query Editor opens with a preview of your API response, typically showing JSON records or lists. Click into Record or List items to drill down into the data structure, use “To Table” to convert lists into tabular format, and click expand arrows on column headers to flatten nested data into separate columns.
Step 4. Refine your data structure for Excel compatibility.
Remove unnecessary columns by right-clicking and selecting “Remove,” rename columns to business-friendly names by double-clicking headers, and change data types using the dropdown arrows (Text, Number, Date, etc.). Add calculated columns or apply filters as needed for your specific use case.
Step 5. Load data and configure automatic refresh.
Click “Close & Load” to import your transformed data into Excel as a table. Right-click the imported table, select “Refresh,” then go to Data → Connections → Properties to set up automatic refresh intervals (every few minutes, hours, or daily).
Automate your Excel data workflows today
Connecting APIs to Excel shouldn’t require technical expertise or consume valuable time. Coefficient eliminates the complexity while providing enterprise-level reliability and real-time data integration. From simple data imports to sophisticated multi-source dashboards, our Excel add-in delivers live insights in minutes instead of hours.Ready to transform your Excel workbooks into dynamic data dashboards? Get started with Coefficient and discover why thousands of teams have eliminated manual data entry forever.


