Databricks is a powerful data analytics platform that helps organizations process and analyze large datasets. By connecting Databricks to Microsoft Excel using Coefficient, you can easily import your key Databricks data into a spreadsheet for further analysis, reporting, and data management.
This tutorial will walk you through the process of setting up the integration and pulling your Databricks data into Excel.
Why Connect Databricks to Excel?
Connecting Databricks to Excel offers several advantages:
- Access real-time Databricks data directly in Excel.
- Utilize Excel’s analytics and visualization tools on Databricks datasets.
- Simplify data sharing and collaboration across teams.
- Combine Databricks data with other sources in Excel for comprehensive analysis.
Three Methods to Connect Databricks to Excel
Let’s explore the top three approaches to integrate Databricks with Excel:
- Coefficient (No-code solution)
- Seamlessly sync Databricks data to Excel without coding
- Automate data refreshes and report distribution
- ODBC Driver (Technical setup)
- Direct connection using Databricks’ official ODBC driver
- Ideal for users comfortable with database connections
- Manual Export/Import:
- Export data from Databricks and import into Excel
- Suitable for one-time or infrequent data transfers
Step-by-Step Tutorial: Connecting Databricks to Excel
Method 1: Coefficient Add-on – The No-Code Solution
Coefficient offers a user-friendly approach to connect Databricks to Excel without any coding.
Step-by-Step Guide
Before we begin, make sure you have Coefficient installed in Excel. If you haven’t done so already, download and install the Coefficient add-in.
- Open Excel from your desktop or in Office Online. Click ‘File’ > ‘Get Add-ins’ > ‘More Add-Ins.’
- Type “Coefficient” in the search bar and click ‘Add.’
- Follow the prompts in the pop-up to complete the installation.
- Once finished, you will see a “Coefficient” tab in the top navigation bar. Click ‘Open Sidebar’ to launch Coefficient.
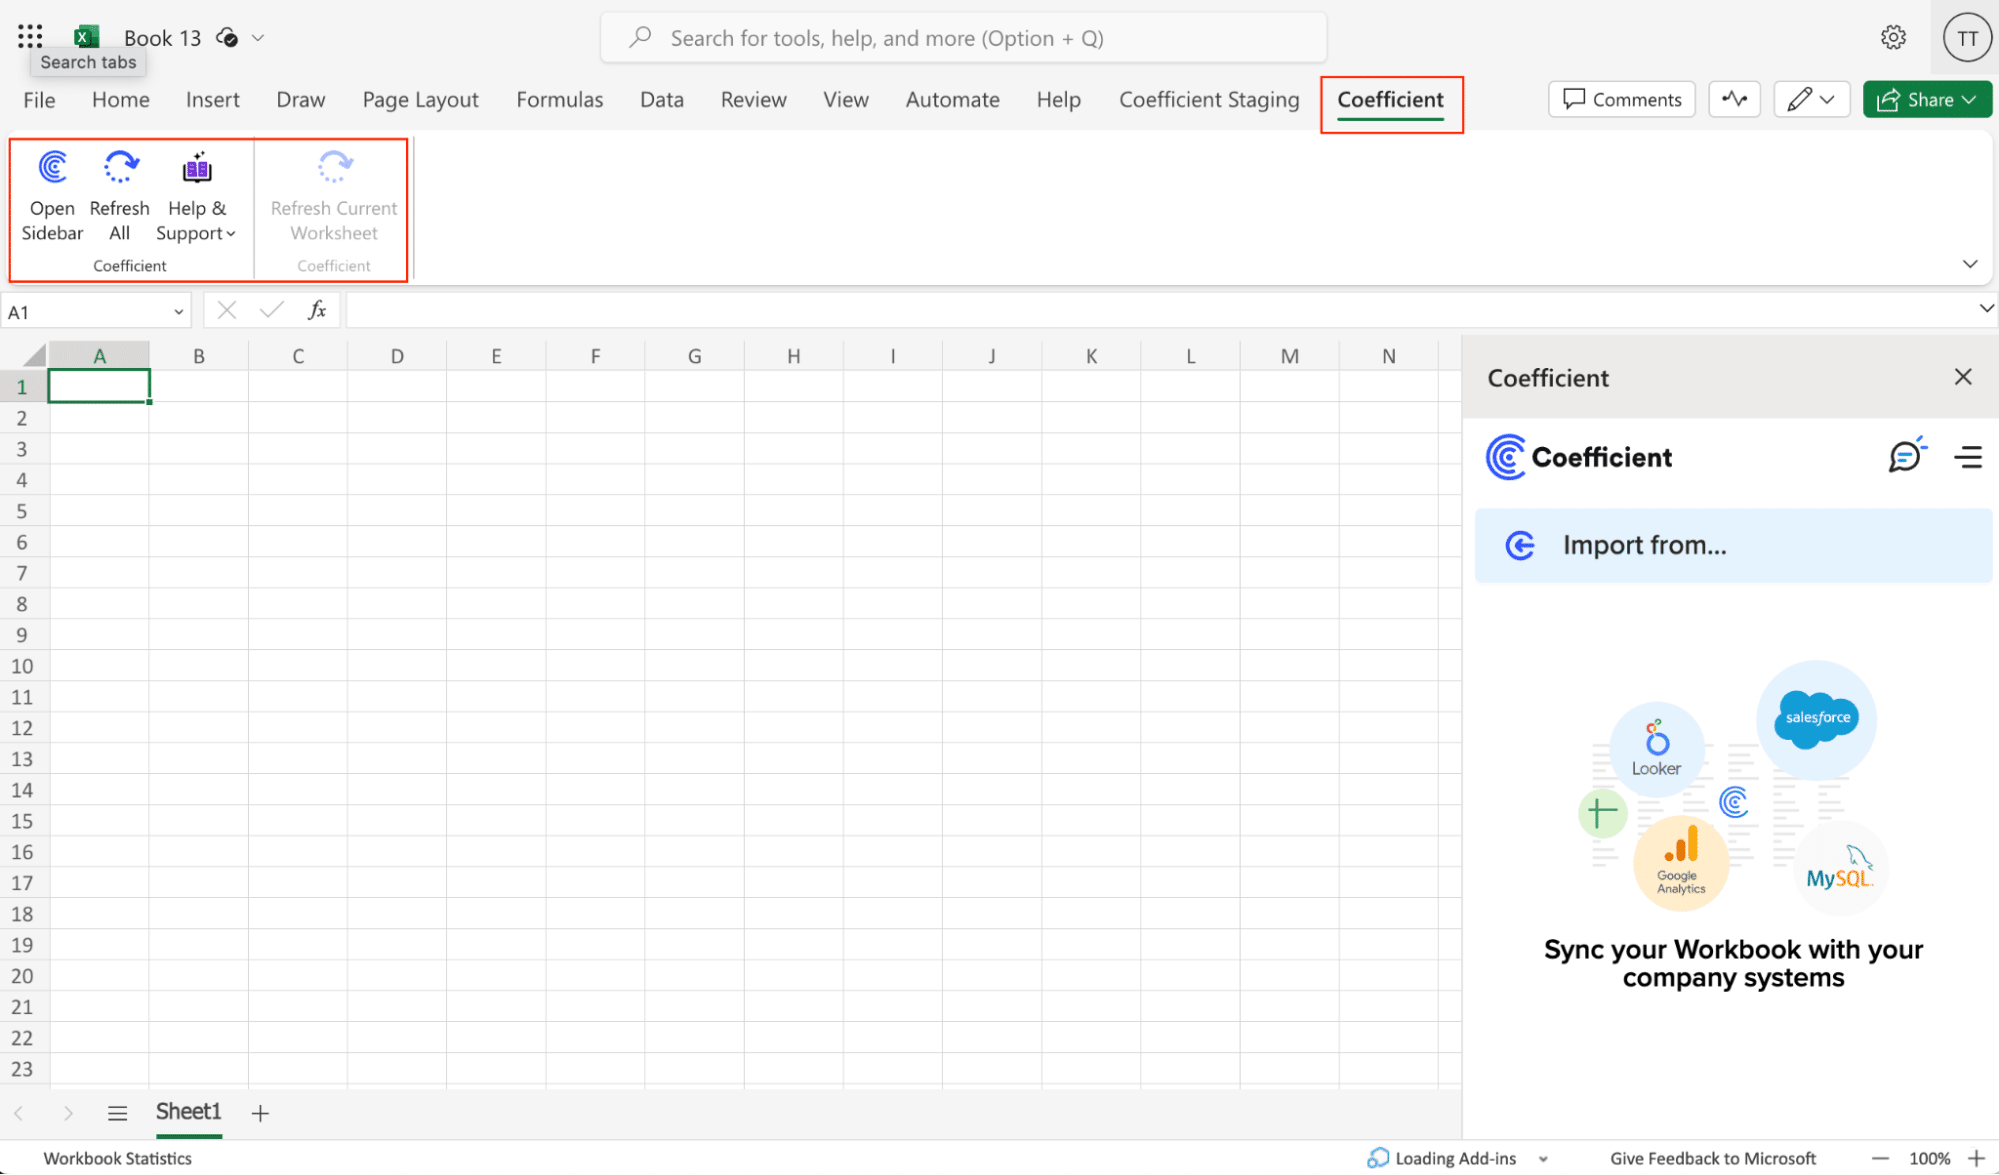
Step 1: Add Databricks as a data source in Coefficient
Click “Import from…” in the menu and choose “Databricks” from the list of available integrations.
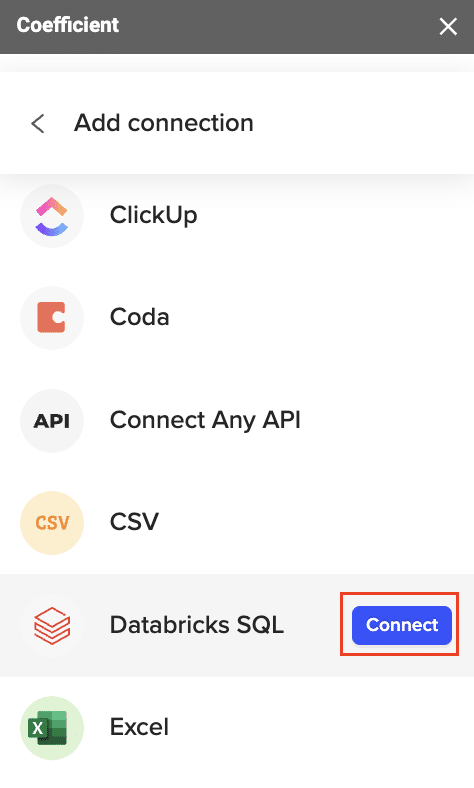
Step2. Connect your Databricks account:
You’ll need to provide your Databricks JDBC URL and access token to authenticate the connection. Enter your information and click “Connect” to finalize the Databricks connection.

Note:
- For help obtaining your JDBC URL and Personal Access Token, click here.
- If you need help finding your “JDBC URL,” click here.
- If you need help generating your Personal Access Token, click here.
Step 3: Import Databricks data into Excel
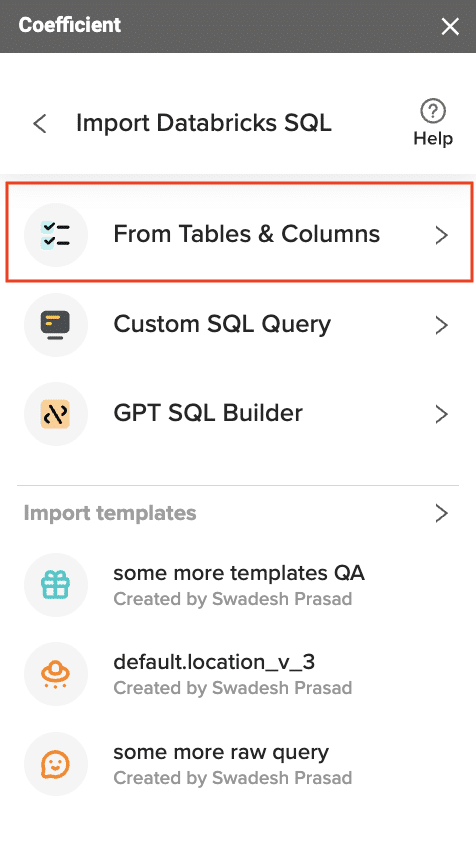
Once connected, return to Databricks from the menu and select “From Tables and Columns.”
Select the table for your import from the available table schemas.
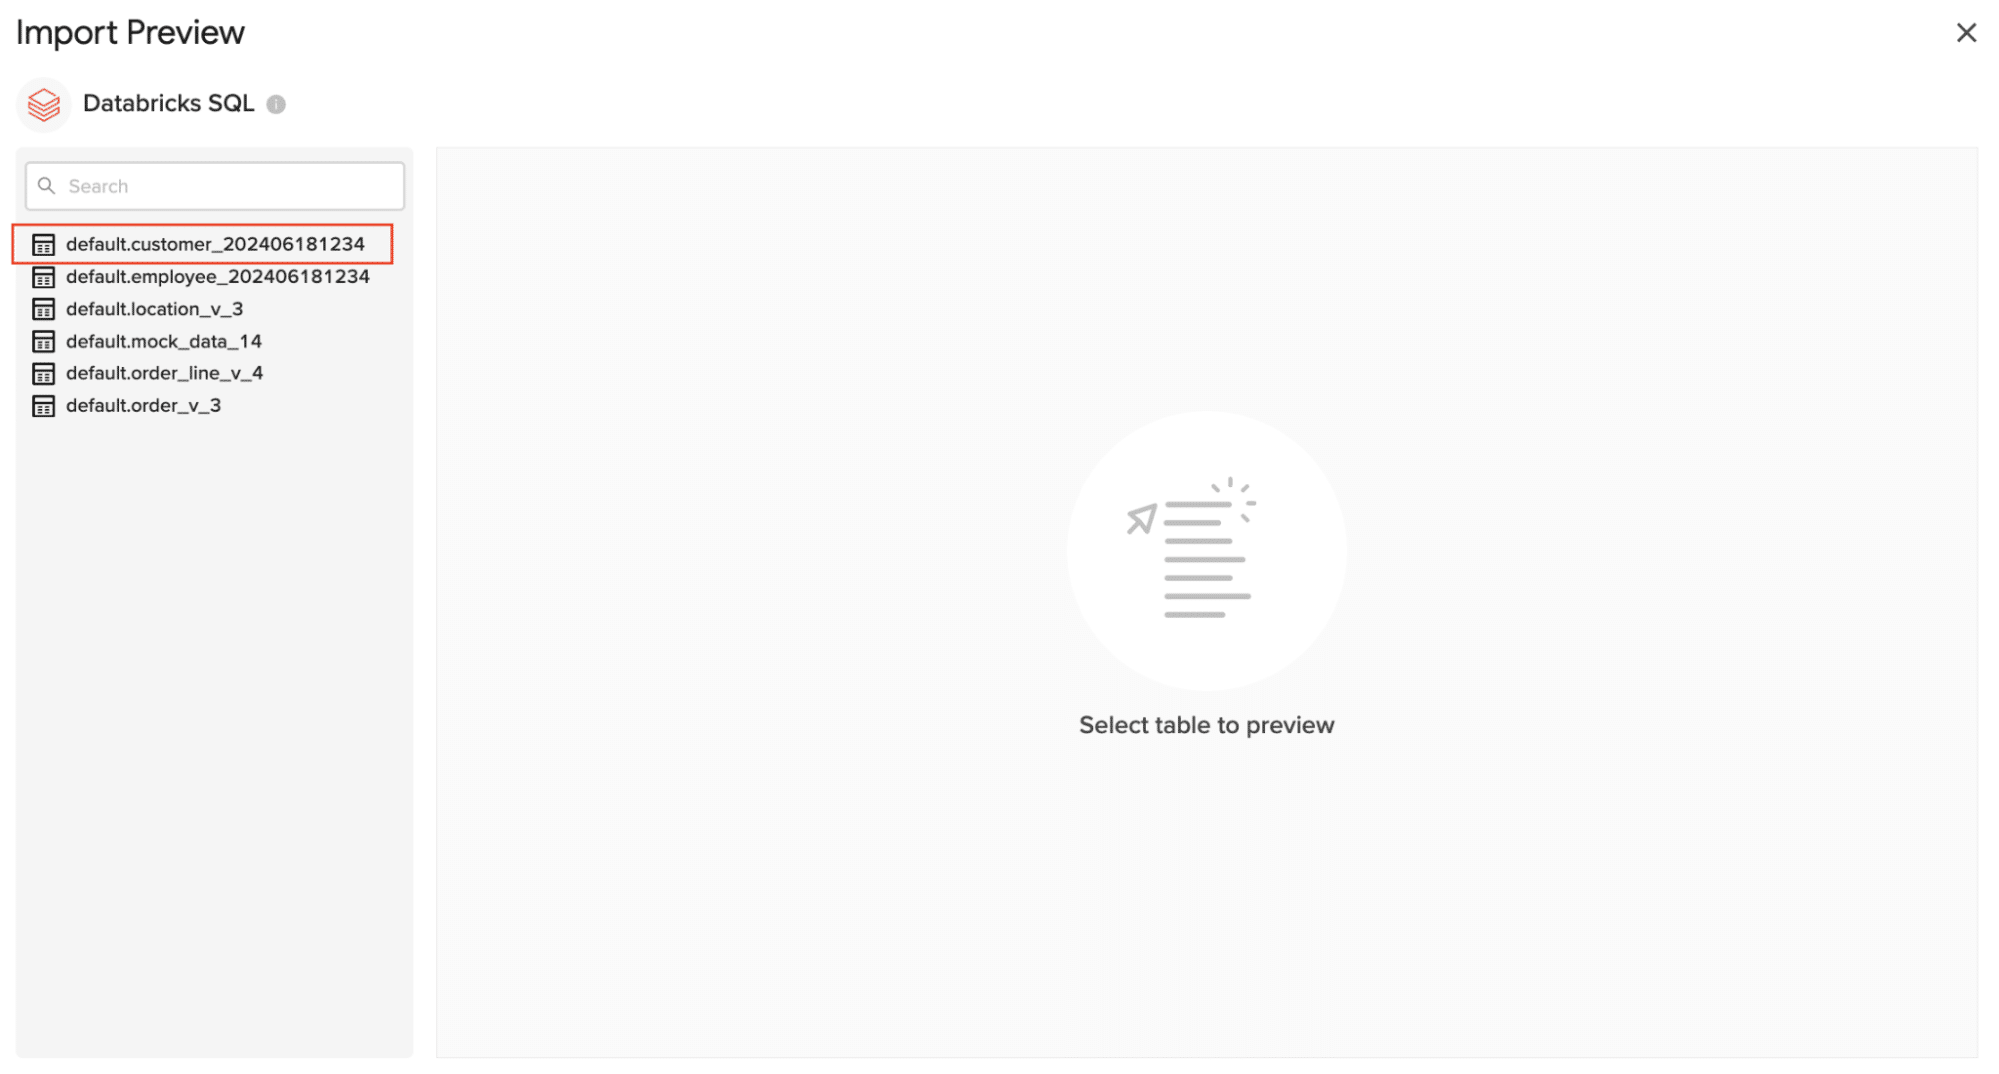
Once the table is selected, the fields within that table will appear in a list on the left side of the Import Preview window. Select the fields you want to include in your import by checking/unchecking the corresponding boxes.
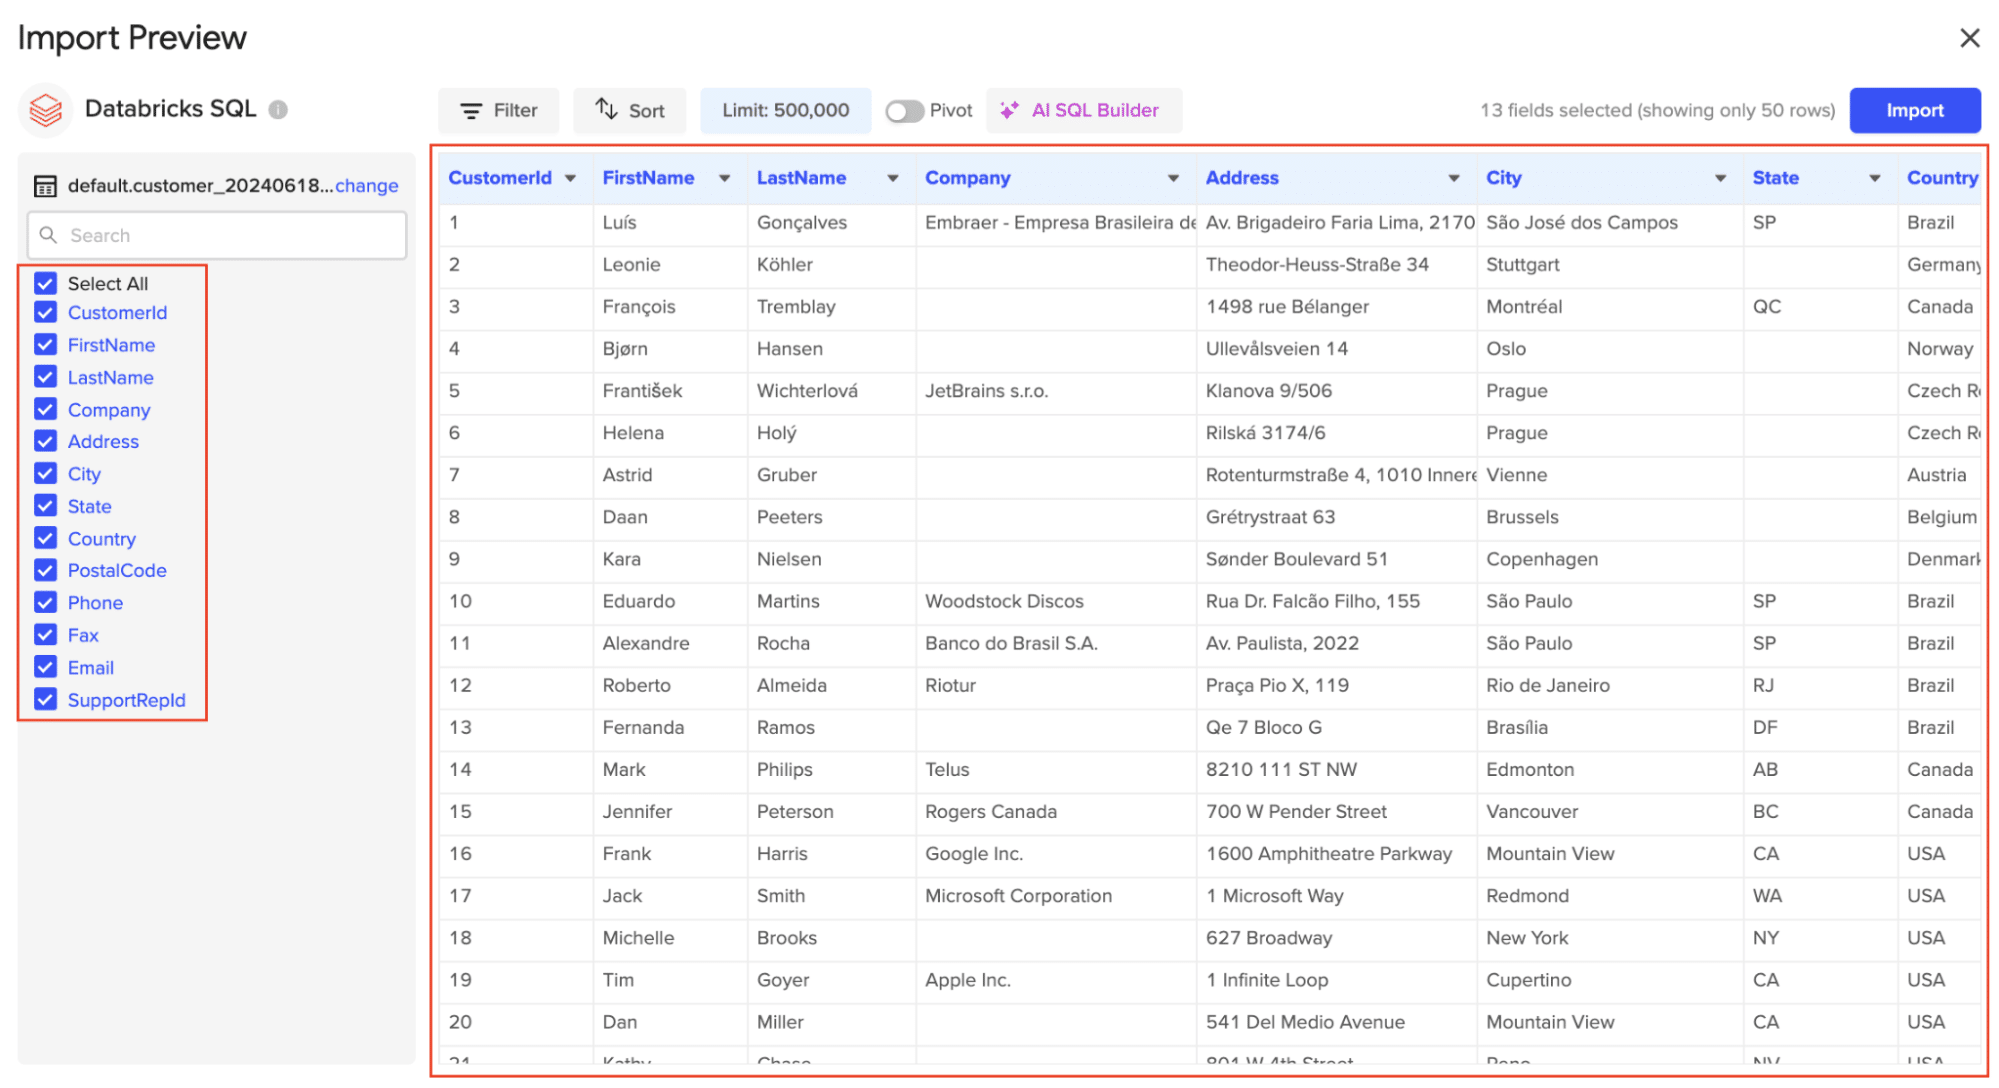
Click “Import” to pull the selected Databricks data into your spreadsheet.
Step 5: Set up auto-refresh for your Databricks data
Configure auto-refresh: Set up an auto-refresh schedule to keep your Databricks data up to date in Excel.
- Click on the Coefficient menu in Excel
- Select “Auto-refresh”
- Choose your preferred refresh frequency (hourly, daily, or weekly)
- Set a specific time for the refresh to occur

Pros and Cons
Pros of using Coefficient:
- The user-friendly interface simplifies the connection process.
- Real-time data syncing ensures your Excel sheet always has the latest information.
- No coding or technical setup is required, making it accessible to all skill levels.
- Automated report refreshing saves time and ensures data accuracy.
Cons of using Coefficient:
- A Coefficient subscription is required to use this method.
Method 2: Using Databricks ODBC Driver
For those comfortable with technical configurations, the Databricks ODBC driver offers a direct connection to Excel.
Step 1: Download and install the Databricks ODBC driver.
- Visit the Databricks documentation website.
- Locate the ODBC driver download page.
- Choose the appropriate driver version for your system (32-bit or 64-bit).
- Download and run the installer, following the prompts to complete the installation.
Step 2: Configure the ODBC driver with your Databricks workspace details.
- Open the ODBC Data Source Administrator on your computer.
- Click “Add” to create a new data source.
- Select the Databricks driver from the list and click “Finish.”
- Enter your Databricks workspace URL, access token, and other required details.
- Test the connection to ensure it’s working correctly.
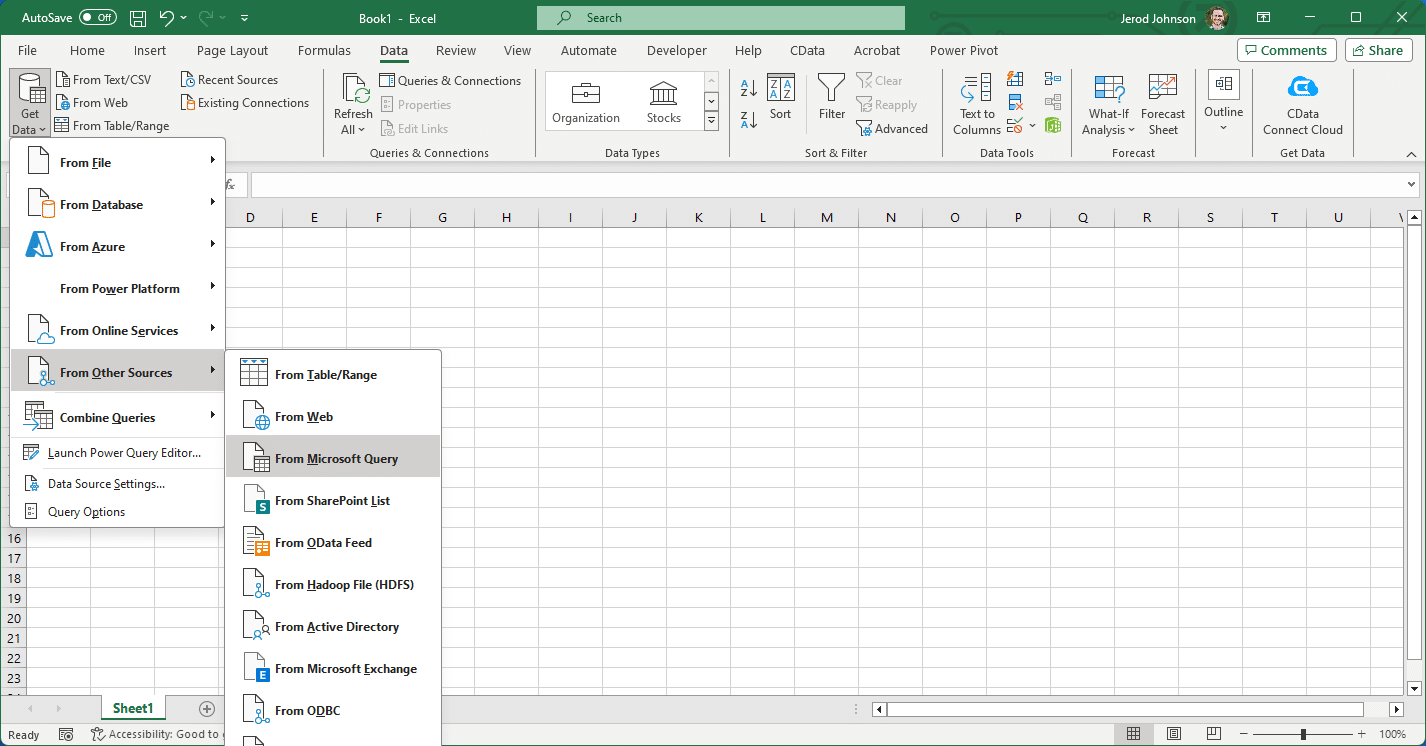
Step 3: Open Excel and navigate to the data connection options.
- Launch Excel and go to the “Data” tab in the ribbon.
- Click on “Get Data” > “From Other Sources” > “From Microsoft Query”
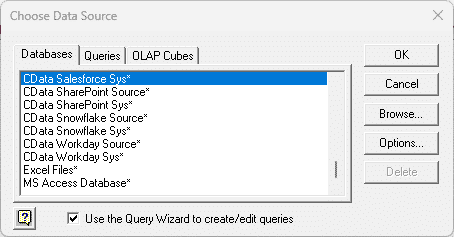
Step 4: Select the Databricks DSN you configured.
- In the ODBC data source selection window, choose the Databricks connection you set up.
- Click “OK” to proceed.
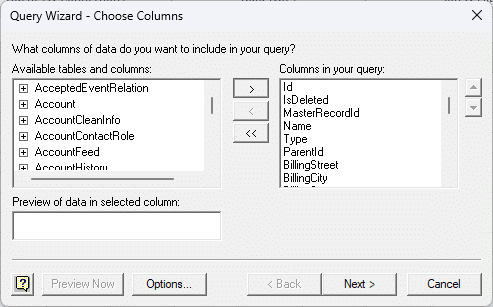
Step 5: Choose the tables or write SQL queries to import data.
- You’ll be presented with a navigator showing available tables in your Databricks workspace.
- Select the tables you want to import, or switch to “Advanced options” to write custom SQL queries.
Step 6: Load the data into Excel.

Stop exporting data manually. Sync data from your business systems into Google Sheets or Excel with Coefficient and set it on a refresh schedule.

- Choose whether to load the data directly into a table
- Click “Load” to import the Databricks data into your Excel worksheet.

Pros and Cons
Pros of using the Databricks ODBC driver:
- The direct connection to Databricks allows for real-time data access.
- Complex SQL queries can be executed directly from Excel.
- No third-party tools are required for this method.
Cons of using the Databricks ODBC driver:
- The technical setup and configuration may be challenging for non-technical users.
- IT support might be necessary for driver installation and maintenance in corporate environments.
Method 3: Manual Export and Import
For occasional data transfers or users without access to the above methods, a manual export-import process can be used.
Step 1: Log in to your Databricks workspace.
- Open your web browser and navigate to your Databricks workspace URL.
- Enter your credentials to log in.
Step 2: Run a query to generate the desired dataset.
- Create a new notebook or open an existing one.
- Write and execute a SQL query to retrieve the data you want to analyze in Excel.
Step 3: Export the results as a CSV file.
- Once your query results are displayed, look for an “Export” or “Download” option.
- Choose to export the data as a CSV (Comma Separated Values) file.
- Save the file to a location on your computer.
Step 4: Open Excel and import the CSV file.
- Launch Microsoft Excel on your computer.
- Go to the “Data” tab in the ribbon.
- Click on “Get Data” > “From File” > “From CSV.”
Step 5: Select the exported CSV file and import the data.
- Browse to the location where you saved the CSV file from Databricks.
- Select the file and click “Import.”
- In the Text Import Wizard, ensure the data is correctly separated into columns.
- Click “Load” to import the data into your Excel worksheet.
Pros and Cons
Pros of the manual export-import method:
- This simple process requires no additional setup or tools.
- It works with any version of Excel, ensuring compatibility.
- The method is useful for one-time or infrequent data transfers.
Cons of the manual export-import method:
- Data is not updated automatically, requiring manual refresh for each change.
- The process can be time-consuming for large or frequent data transfers.
- There’s potential for human error in the export-import process.
Frequently Asked Questions
Can I connect Databricks to Excel?
Yes, you can connect Databricks to Excel using various methods, including the Coefficient add-on, Databricks ODBC driver, or manual export-import. Coefficient offers the most user-friendly solution for seamless integration.
Can Databricks read an Excel file?
Yes, Databricks can read Excel files. You can upload Excel files to Databricks and use libraries like Apache Spark to read and process the data. Coefficient also allows you to push Excel data back to Databricks, simplifying the bi-directional data flow.
How do I connect data to Databricks?
There are multiple ways to connect data to Databricks, including using the Databricks UI, REST API, or various connectors. For Excel users, Coefficient provides an easy way to connect and sync data between Excel and Databricks without any coding.
How do I connect access data to Excel?
While this question is not directly related to Databricks, it’s worth noting that Coefficient supports various data sources, including databases. You can use Coefficient to connect Access data to Excel, similar to how you’d connect Databricks data, providing a unified solution for multiple data sources.
Streamline Your Databricks Workflow with Coefficient
By connecting Databricks to Excel using Coefficient, you can unlock powerful new ways to analyze, report on, and manage your data. With just a few clicks, you can import your Databricks data into Excel and start deriving valuable insights to drive informed decision-making.
Get started with Coefficient today and see how easy it is to bring your Databricks data into Excel for smarter data management.

