


Cost per View (CPV) = Total Advertising Cost / Total Views
Navigating the complexities of digital advertising efficiency often boils down to mastering one key metric: Cost Per View (CPV).
Whether you’re a budding startup or a well-established brand use our our Cost Per View (CPV) Calculator help you budget.
What is CPV?
Marketers use Cost Per View (CPV) to calculate the cost incurred for each view of an advertisement. It’s crucial for evaluating the reach and efficiency of video advertising campaigns, ensuring you’re getting the most out of every dollar spent.
How to Calculate CPV?
- Determine Total Advertising Cost: Identify the total spend of your advertising campaign for a chosen period (e.g., month, quarter).
- Total Views: Tally the total number of views your ad campaign accumulates.
- Calculate CPV: Divide the total advertising cost by the total number of views to pinpoint your CPV.
Example: A campaign costing $1,000 with 20,000 views results in a CPV of $0.05. This figure helps you assess the cost-effectiveness of your ad spend.
The Critical Role of CPV in Your Marketing Strategy
Understanding CPV is key to optimizing advertising budgets and strategies.
A lower CPV means you’re achieving wider visibility without exponentially increasing costs, which is essential for campaigns focusing on brand exposure and engagement.
Elevating Your CPV Game: Effective Optimization Strategies
- Refine Your Target Audience: Sharper targeting increases ad relevance and engagement, potentially lowering your CPV.
- Invest in Quality Ad Content: Engaging content can improve view rates, offering better value for your advertising spend.
- Choose the Right Platforms: Placement of your ads on the most effective platforms can reduce costs and increase views.
- Analyze and Adjust: Continuously monitor campaign performance to identify opportunities for improvement.
- Budget Optimization: Adjust your ad spend based on campaign outcomes to ensure efficient use of resources.
CPV in Practice: Real-World Example
Consider a campaign with a $2,000 budget that achieves 50,000 views, resulting in a CPV of $0.04. This efficiency showcases the campaign’s success in leveraging the allocated budget to maximize visibility and engagement.
Calculating CPV in Google Sheets
- Input your total advertising cost in cell A1.
- Enter the total number of views in cell A2.
- Use the formula =A1/A2 in cell A3 to calculate your CPV.
Drawbacks of CPV Calculation
- Market Fluctuations: CPV calculations may not always reflect changing market conditions accurately.
- Seasonal Variations: It does not consider seasonal impacts on viewer engagement.
- Performance Anomalies: Unusual performance spikes or drops can distort CPV accuracy.
When to Use the CPV Calculator?
This tool is vital for planning new video ad campaigns or optimizing existing ones, particularly useful for marketers aiming to measure ad spend efficiency on platforms like YouTube.
Incorporating Advanced Strategies
- Explore CPA and ROAS: Enhance your bidding strategy by considering Cost Per Acquisition and Return on Ad Spend.
- Implement Conversion Tracking: Measure the effectiveness of your ads across different campaigns.
- Stay Updated: Regularly adjust your Google Ads account and budget to align with changing ad costs.
- SEO and Keyword Research: Maximize your campaign’s visibility through diligent research and optimization.
- Adapt Flexibly: Respond to algorithm changes with a flexible strategy and budget planning.
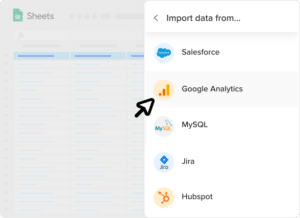 Sync Live Data into Your Spreadsheet


