Linear regression reveals data relationships. It’s crucial for informed decisions. Google Sheets simplifies this with built-in functions. You don’t need complex software.
This guide explains using Google Sheets for linear regression. It suits both beginners and professionals.
Setting up Data for Regression Analysis
In performing regression analysis with Google Sheets, the primary step involves organizing your dataset to facilitate the creation of a regression model. Accurate data range selection and preliminary visualization through scatter plots are fundamental to the process.
Preparing Data Ranges
The preparation of data within Google Sheets requires having your independent variables (predictors) and dependent variables (responses) neatly organized in separate columns.
Each variable should have its column, ensuring there are no missing values, and the data types are consistent throughout the column. For instance:
| Independent Variable (X) | Dependent Variable (Y) |
| X1 | Y1 |
| X2 | Y2 |
| … | … |
| Xn | Yn |
To denote the range of data you want to analyze, specify the cells that contain your variables. This designated range should be input correctly when using any of Google Sheets’ data analysis tools.
Creating a Scatter Plot
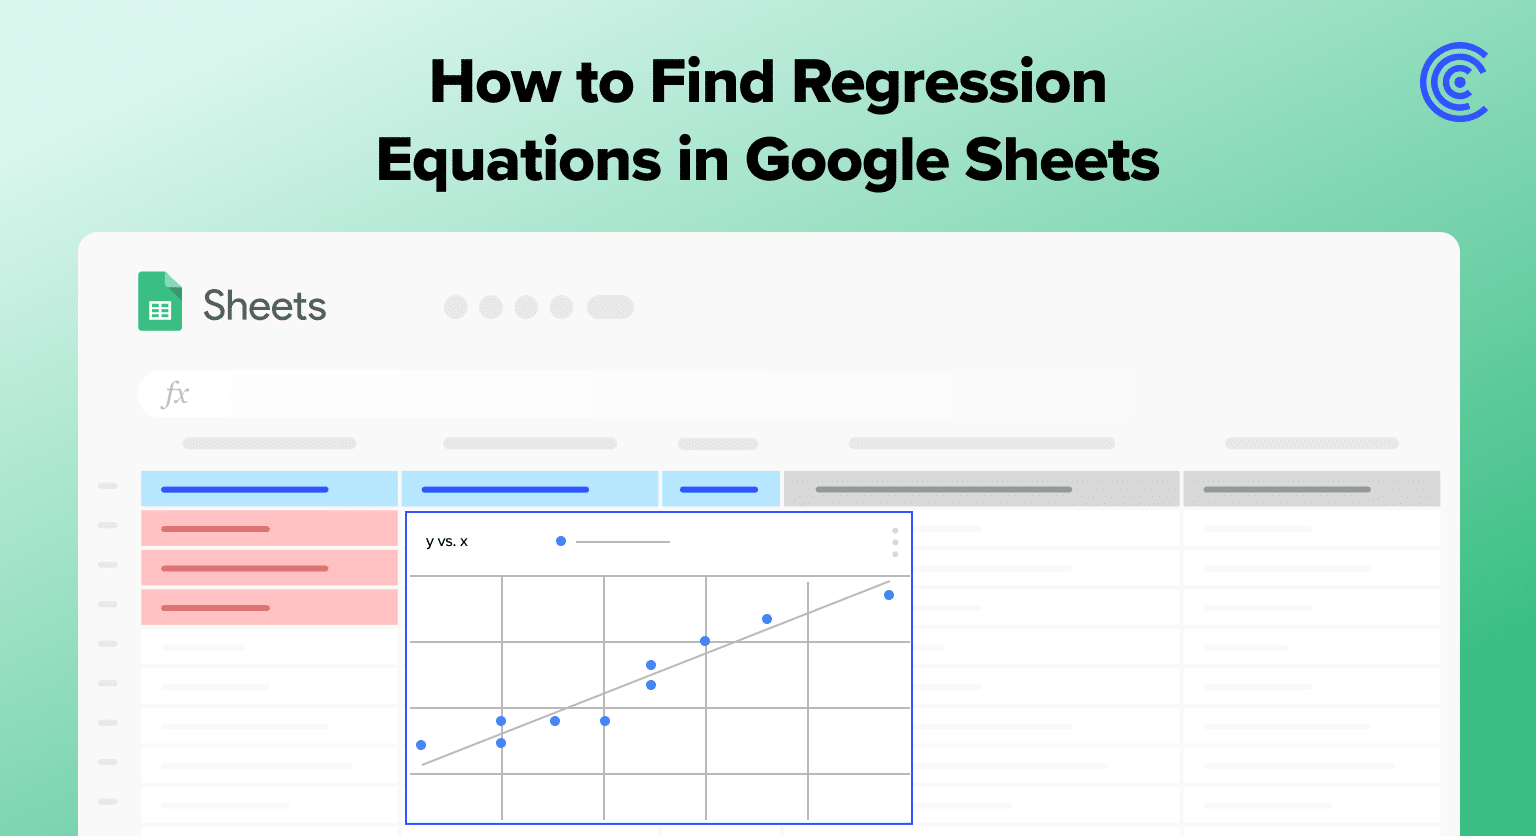
A scatter plot is a useful tool for visualizing the relationship between the independent (X-axis) and dependent (Y-axis) variables. To create one in Google Sheets:
- Highlight the relevant data range, including headers.
- Navigate to the Insert menu and choose Chart.
- In the Chart Editor sidebar that appears, select the Scatter chart type.
Creating this chart provides an immediate visual indication of the correlation between the variables, which is essential before proceeding to the linear regression analysis.
The scatter plot assists in verifying if the data distribution suggests a linear trend before applying the regression tools.
Finding the Regression Equation
To find a regression equation in Google Sheets, users must effectively employ the LINEST function. This function assists in determining the statistical relationship between one dependent variable and one or more independent variables.
Using LINEST Function
The LINEST function is a powerful Google Sheets tool used for performing linear regression analysis. Users begin by selecting an empty cell and typing =LINEST( followed by their data ranges.
Specifically, known_data_y includes the dependent variable data, whereas known_data_x contains one or more sets of independent variable data. The use of calculate_b and the verbose parameter, set to TRUE, provides additional regression statistics.
Example Syntax:

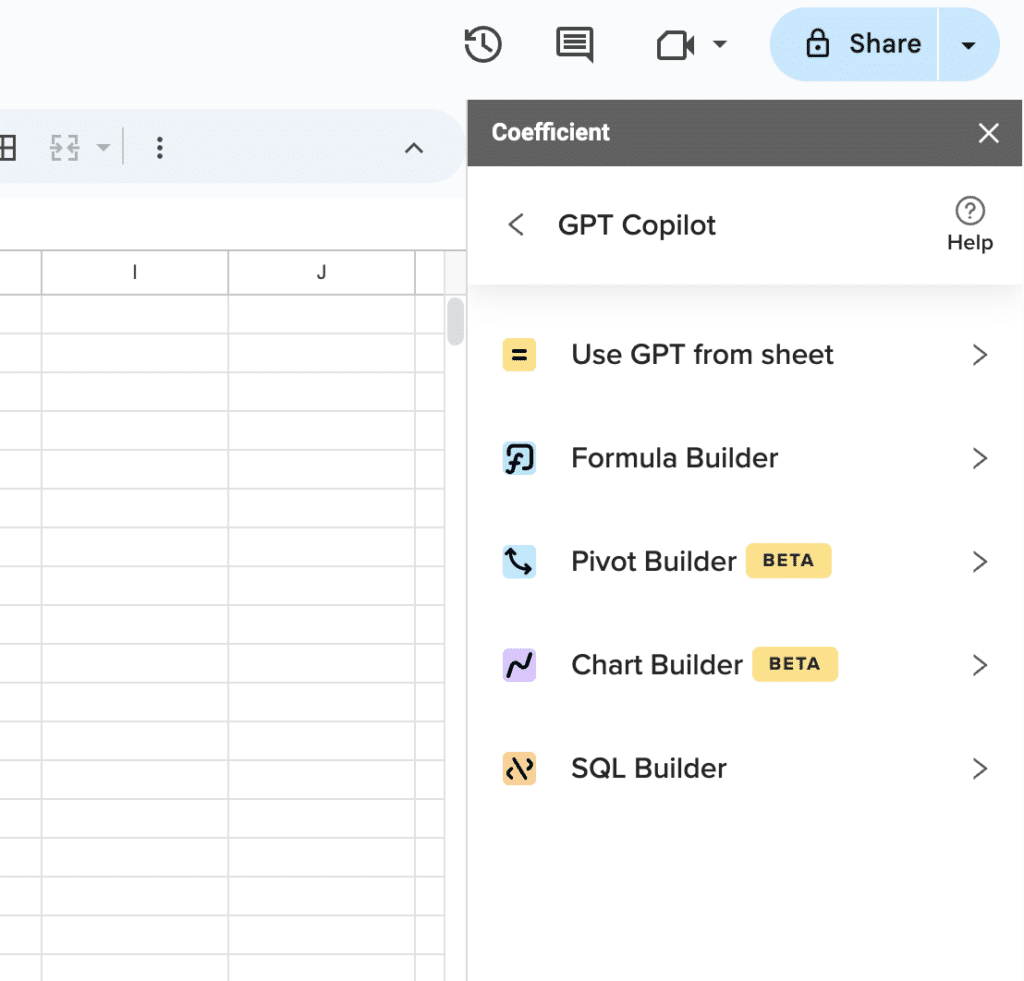
Supercharge your spreadsheets with GPT-powered AI tools for building formulas, charts, pivots, SQL and more. Simple prompts for automatic generation.

=LINEST(known_data_y, known_data_x, calculate_b, verbose)
Understanding Regression Output
The output from LINEST includes an array of values with coefficients representing the slope and intercept of the regression line. The intercept, or the expected value of the dependent variable when all independent variables are zero, is crucial.
The slope signifies the change in the dependent variable with a one-unit change in an independent variable. Other important statistics like the standard error, coefficient of determination (R^2), and F statistic provide insights into the regression model’s accuracy and predictability.
Applying the Equation for Prediction
Once the coefficients (slope and intercept) are obtained, one can forecast future values of the dependent variable. The regression equation is formulated as Y = a + bX, where Y is the dependent variable, X is the independent variable(s), b indicates the slope, and a represents the y-intercept.
This equation helps in forming a trendline that can predict the dependent variable’s potential outputs based on various independent variable inputs. Understanding and calculating the degrees of freedom, standard deviation, and other regression statistics aid in evaluating the significance and confidence of the forecast model.
Conclusion
Google Sheets makes linear regression easy. You can predict outcomes and analyze trends. Try it for your business forecasts or research.
Ready to upgrade your data analysis? Install Coefficient for even more powerful Google Sheets integration.


