Learn how to quickly make a frequency table in Google Sheets.
This guide simplifies data analysis for B2B SaaS business teams.
Creating a Frequency Table in Google Sheets
Creating a frequency table in Google Sheets allows users to organize and analyze data efficiently by displaying the frequency of unique values within a dataset.
Preparing Your Dataset
Initially, ensure that your dataset is properly organized, with relevant data in rows and columns. Each column should represent a variable, such as ages, and each row should contain the data values for that variable.
Utilizing the Frequency Function
To calculate frequencies, use the FREQUENCY function, which requires two ranges of cells: the data array and the bins array. The data array should include the values you want to count, and the bins array should specify the intervals or classes into which these values are grouped.
Formatting the Frequency Table
Once the FREQUENCY function is applied, it outputs the count of values falling into each bin. Create a new column labelled ‘Frequency’ to host these results, and consider using conditional formatting to enhance the readability of your frequency table.
Analyzing the Results
Perform analysis by reviewing the frequency distributions, which tell you how often each unique value or bin appears in your data. You might convert these counts to percentages by dividing by the total number of values, and then multiplying by 100 and using the ROUND function for cleaner numbers.
Advanced Techniques
To deepen data analysis in Google Sheets, advanced techniques involving pivot tables, percentage calculations, and data organization can offer enhanced insights. These methods allow for a more sophisticated interpretation of frequency data.

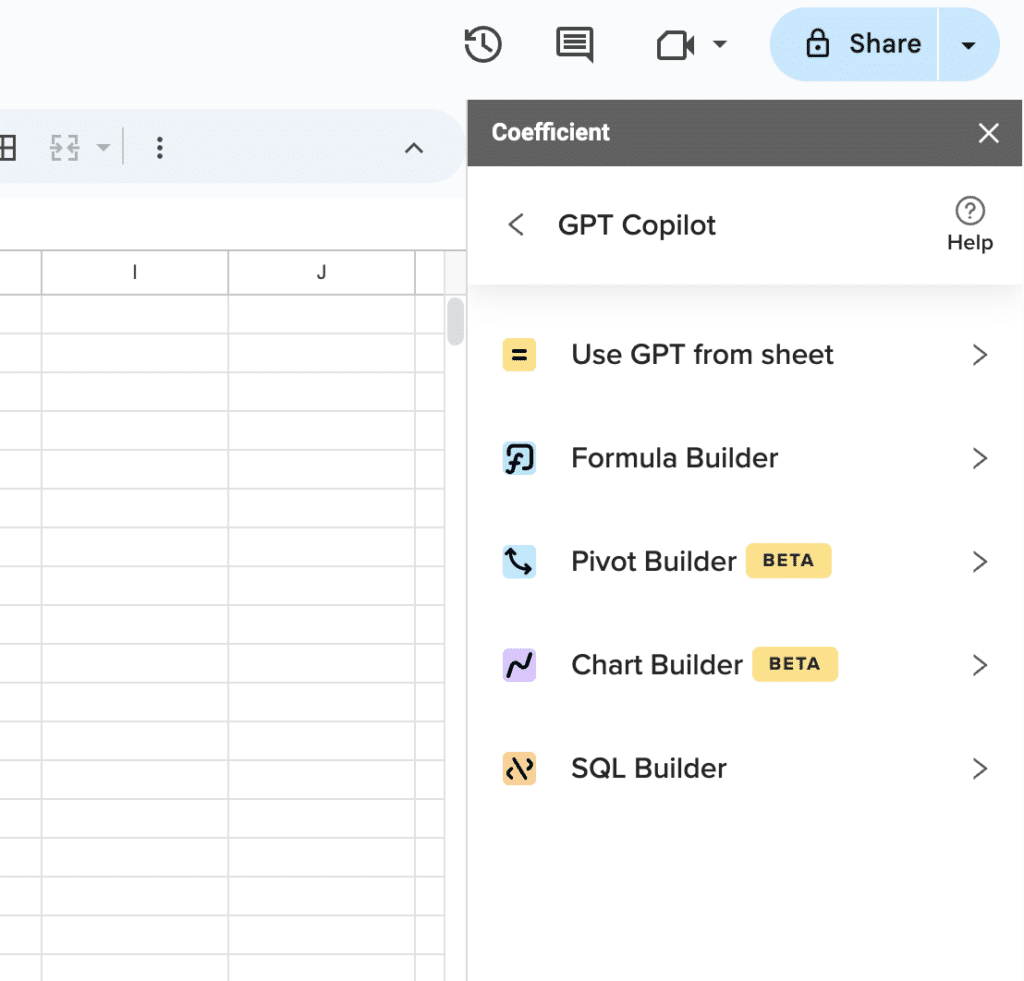
Supercharge your spreadsheets with GPT-powered AI tools for building formulas, charts, pivots, SQL and more. Simple prompts for automatic generation.

Implementing Pivot Tables for Frequency Analysis
A pivot table is a powerful tool for summarizing and analyzing data in Google Sheets. To create a frequency table using a pivot table, one begins by selecting the entire dataset. Then, they navigate to Data > Pivot table to create a new pivot table. The selected category serves as rows, and the count of unique data points can be displayed by setting Values to count.
Calculating Percentages for Data Interpretation
Understanding the relative significance of data is essential. To calculate percentages, use the formula =COUNTIF(range, criterion)/COUNTA(range) to find the count of individuals within each category, dividing by the total number of entries. The results can be formatted as percentages for clearer interpretation, illustrating what proportion of the dataset falls into each class or bin.
Organizing Data with Classes and Intervals
When the data includes a range of numerical values, organizing data into classes or intervals (also known as bins) can be very informative. Using the =FREQUENCY(data_array, bins_array) function, one can create a histogram or frequency distribution. Initially, define the bin ranges in a separate column and use the formula alongside the defined bins to display counts per range. This method helps reveal the distribution and central tendencies within the data set.
Conclusion
Creating a frequency table in Google Sheets is straightforward. It’s a powerful tool for data analysis in business operations.
Ready to improve your data analysis with Coefficient? Get started here.


