Overview
Google Sheets is going beyond the run-of-the-mill spreadsheet functions, formulas, and chart-building options.
With its new and upcoming features and functionalities, Google Sheets is becoming a powerhouse tool for your data analysis, reporting, and even your team collaboration and communication.
This guide looks into the future of Google Sheets, its updates, and how it can be a better option for Excel users who want to supercharge spreadsheet tasks and functions.
How Google Sheets is changing the business world
Google Sheets brings in additional features, tools, and integrations, changing the way you handle your spreadsheet data.
Greg Meyer, a data innovator for sales operations, shared his two cents on how Google Sheets is becoming a platform and not just a stand-alone spreadsheet.
See how the new Google Sheets features and functionalities can transform your data analysis and reporting processes below.
Facilitate efficient workflows
Google is developing new products for Google Workspace, including Smart Canvas, a feature that makes Google Slides, Docs, and Sheets smarter and more advanced.
Essentially, the update allows the Google Workspace solutions to be less tied to a fixed format and become more interactive and flexible to use.
For instance, you can tag other users in a document by typing @ and selecting the person’s name. Other features include letting you add task milestones, project trackers, and statuses to your documents and Google Sheets smart table.
Google is also introducing necessary coeff-templates to let you create a Workspace table document that works as a collaboration tool.
With this, you’ll get a combination of familiar text and spreadsheet tools, including features from popular collaboration platforms. This will also make it possible to integrate Google Workspace solutions, such as Sheets and Slides, seamlessly to streamline your report generation and data visualization processes.
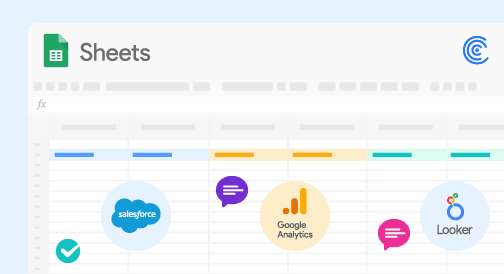
The best part about this is you can use Coefficient, a powerful app with data connector features to supercharge your data importing and syncing for efficient analysis and reporting.
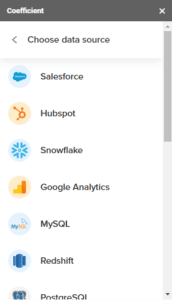
Coefficient provides a seamless and easy way to link and sync your datasets from your data source to Google Sheets, and in turn, get live data for your graphs and reports on your slides.
The app offers a simplified method on how to update Google Sheets automatically to make your reporting and other related workflows more efficient.
If you’re thinking, how can I get Google Sheets to auto-update a reference to another sheet?
The Coefficient app can help you address this by letting you add new fields into one or multiple sheets from the same report without creating new data imports. You can then set auto-refresh schedules to update your data automatically.
Google is also making the Chat messaging option, now called Spaces, available for all users. Spaces is essentially chat rooms but with distinct top-level communication for Gmail, Meet, and Chat.
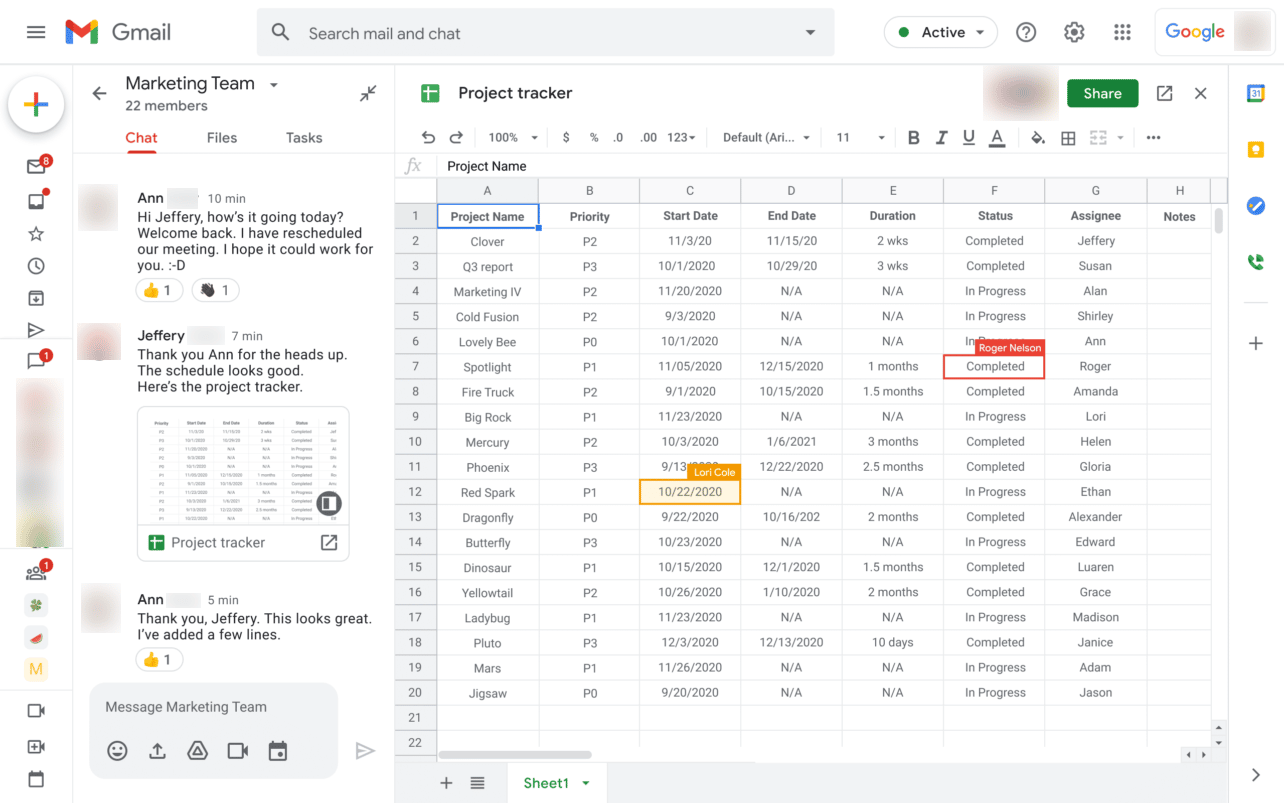
Image source: Techzine.eu
Google will equip Spaces with improved message threading and moderation tools, working almost like Slack and other email groups.
Analyze big data seamlessly through Connected Sheets
One of the new Google Sheets updates that lets you analyze millions and even billions of data rows using regular formulas and pivot tables is Connected Sheets.
Connected Sheets is a new feature for G Suite Enterprise, G Suite Essentials, and G Suite Enterprise for Education customers.
The regular Google spreadsheet features only let you handle up to five million cells, but Connected Sheets analyzes up to billions of rows of data.
Using Connected Sheets requires SQL coding knowledge since your data lives in Google BiqQuery.
Connected Sheets have operations similar to your regular Google Sheets datasets but with a much larger data volume. These operations include:
- Running a specific set of functions on your big datasets.
- Making calculated columns using tables with up to billions of rows of data within BigQuery.
- Bringing out Extracts, which are small data tables from your big datasets. You can use these like regular Google Sheets tables.
- Building pivot tables out of your big datasets.
- Scheduling data auto-refresh tasks to keep your datasets updated.
A sample use case of Connected Sheets is to get specific answers from your dataset given that you know what you want to find.
Connect your Google spreadsheet to your BigQuery data by navigating to the Menu > Data > Data connectors, then choose BigQuery.
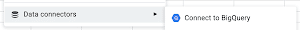
Image source: Cloud.google.com
Choose your project, dataset, and table, and voila, your spreadsheet should now be connected to your BigQuery data.
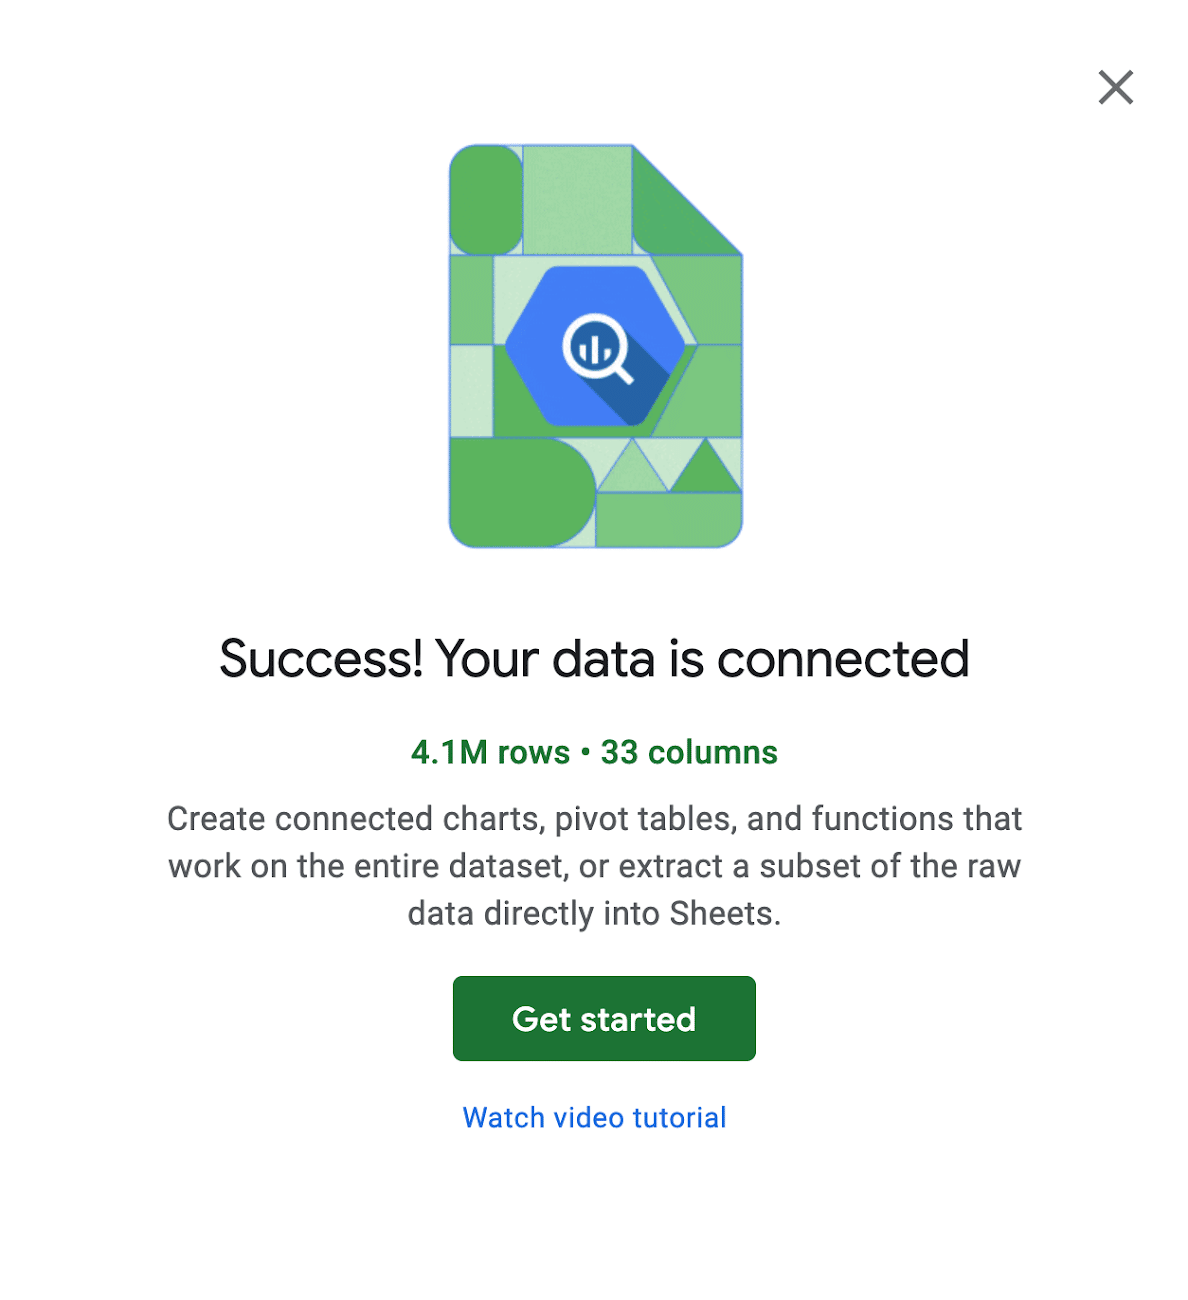
Image source: Cloud.google.com
Let’s say you want to count the number of rows of data within your dataset. You’d be using the COUNT function on your regular spreadsheet. The same operation applies to your big dataset in the Connected Sheets.
Here’s what the formula can look like if you’re using the COUNT function with a regular Google spreadsheet: =COUNT(Your desired data range)
Click Apply to activate the function, and you should get the values you want.
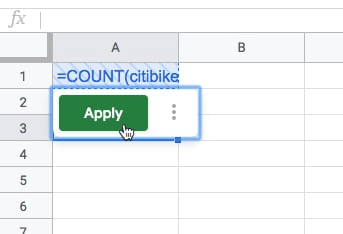
Image source: Benlcollins.com
To execute this same operation in BigQuery using Google Sheets, write a simple query using the BigQuery editor.
Here’s what the simple query can look like.
SELECT
COUNT(your desired data range)
FROM
`Your BigQuery data source file name`
You should get the same results using the simple formula, but as you can see, this method requires BigQuery and basic SQL writing knowledge.

Stop exporting data manually. Sync data from your business systems into Google Sheets or Excel with Coefficient and set it on a refresh schedule.

With Connected Sheets, you can connect Google Sheets to your BigQuery data warehouse. This allows you to work with massive datasets from the comfort and familiarity of the Google Sheets interface.
Streamline spreadsheet data preparation and analysis
Google Sheets makes it easy to prepare and analyze your spreadsheet data through the Smart Cleanup features.
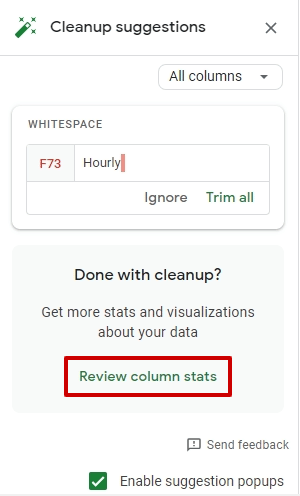
The Cleanup suggestions option automatically identifies and suggests fixes for common data errors to help you ensure your data is correct and accurate.
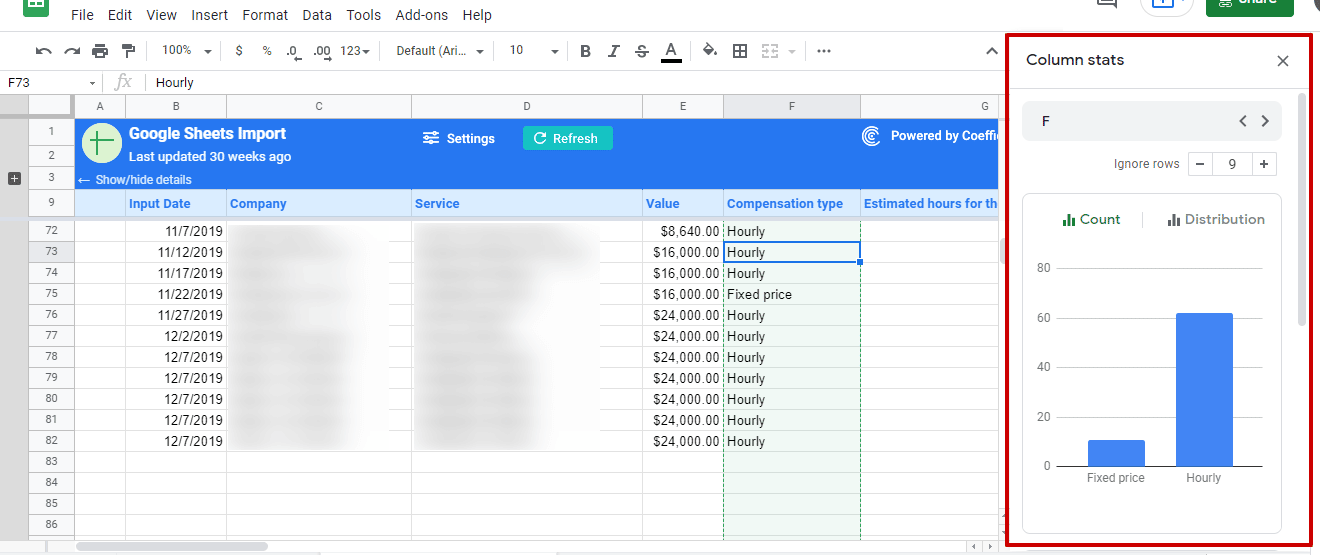
The column stats tool gives you automated insights about values within the data columns. This allows you to identify any outliers and to make sense of your data quickly.
These features streamline identifying possible cleanup actions and spotting simple errors that might distort your data. You can perform faster data analysis by generating smart views that bring out insights you can use to get the most out of your data.
Access the Cleanup suggestions feature by clicking Data on the Google Sheets menu and selecting Cleanup suggestions.
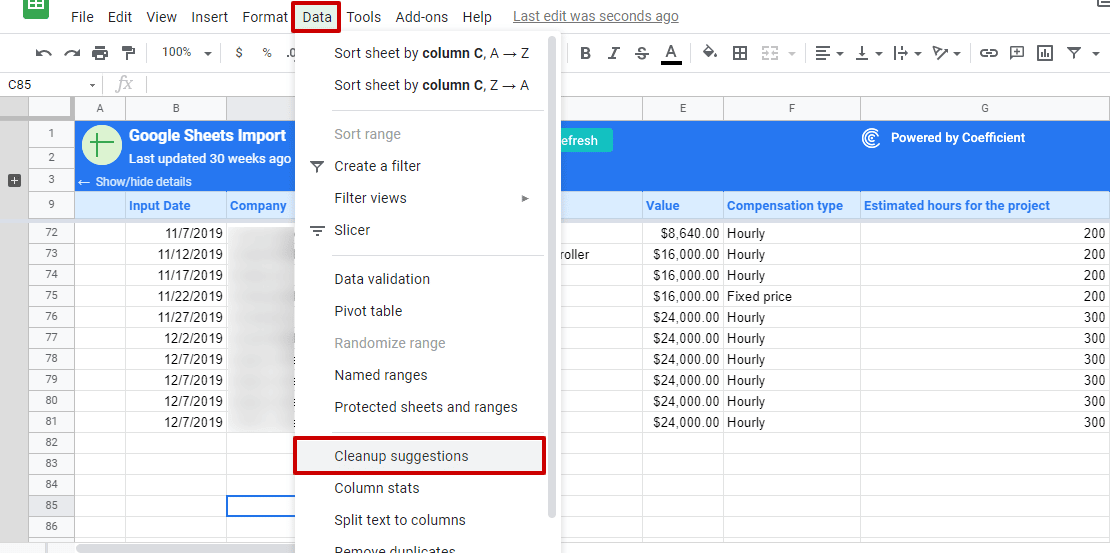
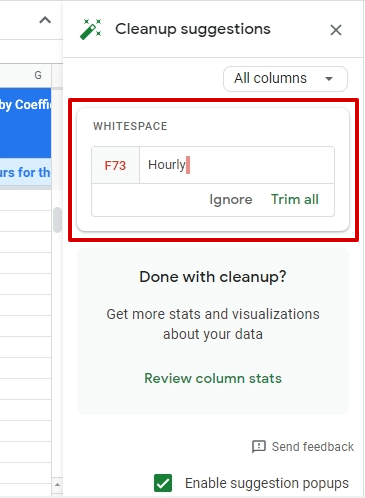
Doing so should surface intelligent suggestions from your data that appear as a side panel in Google Sheets.
The suggestions can include removing duplicate rows and extra spaces, spotting anomalies, fixing inconsistent data, and adding number formatting.
The column stats feature helps you make sense of your data quickly by generating automated visualizations and vital statistics that give you insights into data within specific columns.
Click Data on the Google Sheets menu, then Column stats or the Review column stats option within the Cleanup suggestions side panel, to generate the automatic data insights.
Some of these insights include summary statistics, frequency tables, and count and distribution charts that quickly allow you to see potential outliers, correct your data, and speed up your analysis and report generation.
Customize chart text and number formatting
Google Sheets offers better and faster chart text and numbers customization, including options that let you:
- Simplify formatting single data points, legend items, and individual data labels through a contextual sidebar editing experience.
- Configure advanced number formatting on your axis and data labels, including an option to apply conditional formatting by color.
- Click on (almost) any chart text element to quickly update its style and content, such as legend items and data labels.
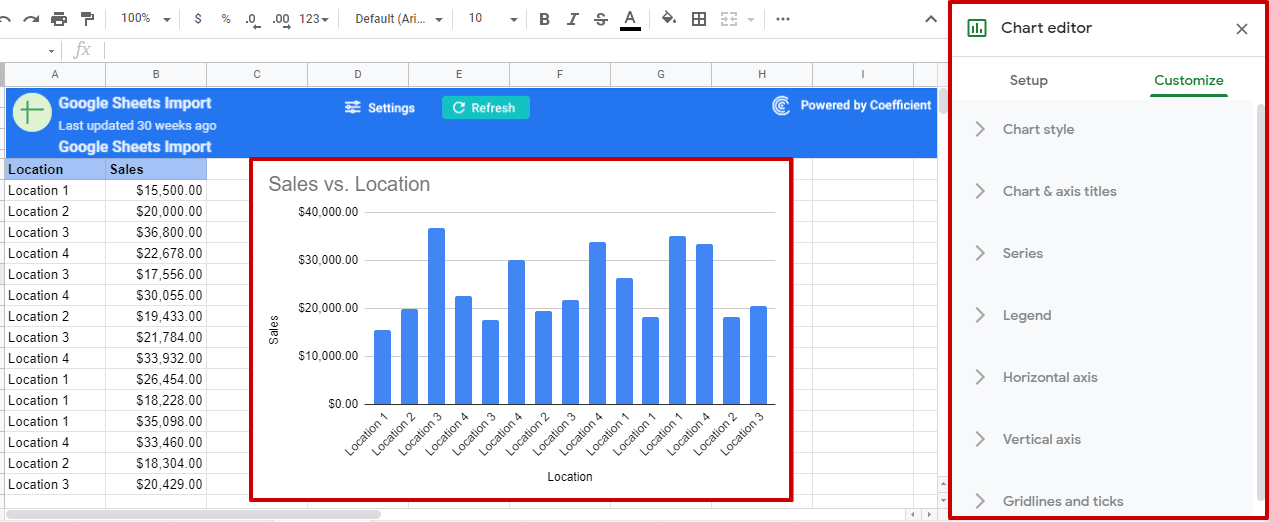
With these advanced chart editing options, you can easily customize your visualizations to best present your data the way you want for your reports and analyses right from Google Sheets.
Automate data entry
The future of Google Sheets is to allow users to automate data entry. Since July 2020, Google Sheets made SmartFill available — a feature that catches and learns patterns between columns to provide intelligent autocomplete data entry.
Let’s say you have one column containing a list of addresses, and you want to create a separate column with only their zip codes.
Google Sheets will find patterns as you start typing data into your spreadsheet. Once it detects one, Sheets will automatically generate a corresponding formula and autocomplete the rest of the column’s data for you.
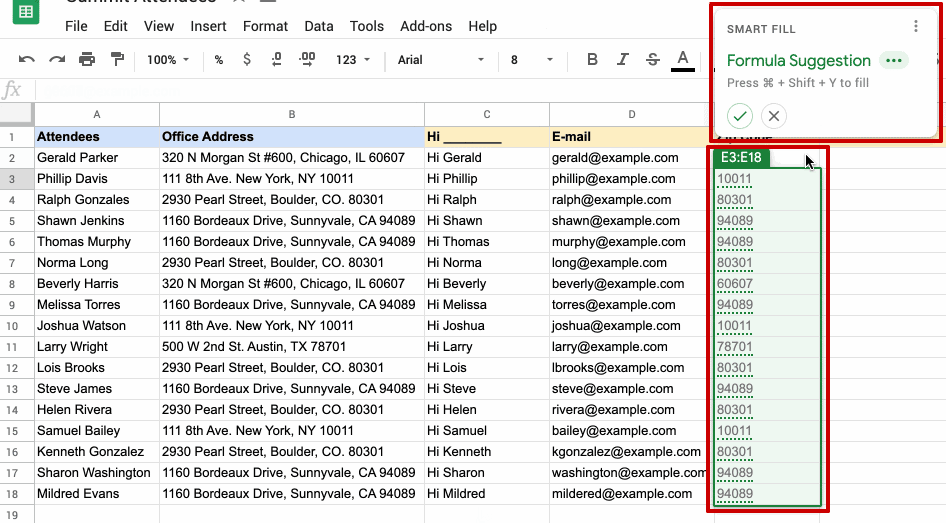
Image Source: Workspaceupdates.googleblog.com
Click on a cell to see the formula used, such as this one:
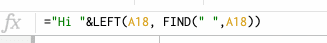
Image source: Workspaceupdates.googleblog.com
SmartFill streamlines preparing and handling your data in Google Sheets, similar to Gmail’s Smart Compose feature to help you input data more quickly with fewer errors.
Additionally, SmartFill can use data from Google’s Knowledge Graph, allowing it to use public data to autocomplete, let’s say, a list of countries where cities are located.
The Google Sheets intelligent features can help automate your data preparation and analysis, allowing you to generate reports and extract insights more efficiently.
Start leveraging the power of Google Sheets and connected spreadsheets
Google Sheets is no longer a simple spreadsheet program. It is becoming a robust, feature-packed, and handy platform for reporting and data analysis.
While Google Sheets started 40 years ago, it’s still one of the most popular and widely used tools for storing, organizing, reporting, analyzing, and even visualizing data.
Its updates and features, such as Connected sheets and integrations with apps, such as Coefficient, have only made it more powerful since it allows handling big data in Sheets and seamless data importing and syncing, supercharging data processing.
With this and future developments, Google Sheets will potentially remain relevant in the years to come.
Try Coefficient for free today!


