Close Opps. Hit Targets. Play to Win.
Our Salesforce Sales Opportunity Template enables sales teams to control their destinies. Track your sales leads, from the first touchpoints, to the final close, and combine the sales funnel with individual and team targets to merge monitoring with sales performance. And the best part? This all-in-one dashboard is perfect for any small business looking to streamline their sales efforts.
Our Sales Opportunity Template makes your life easier:
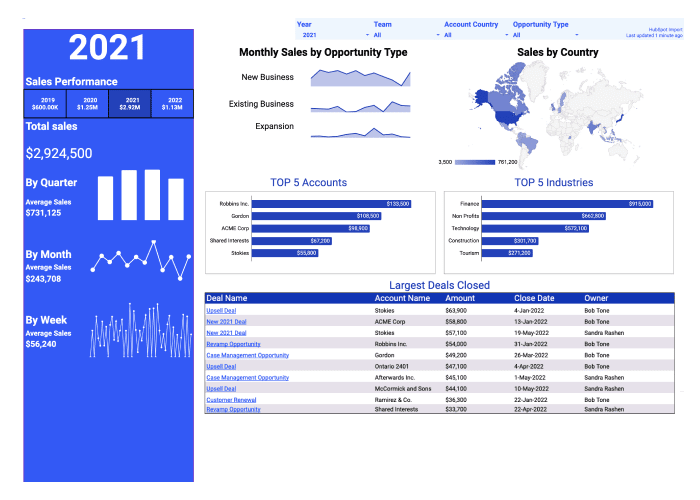
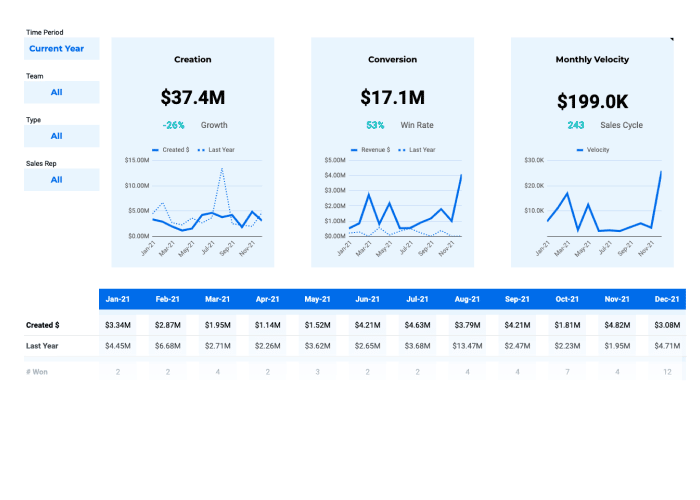
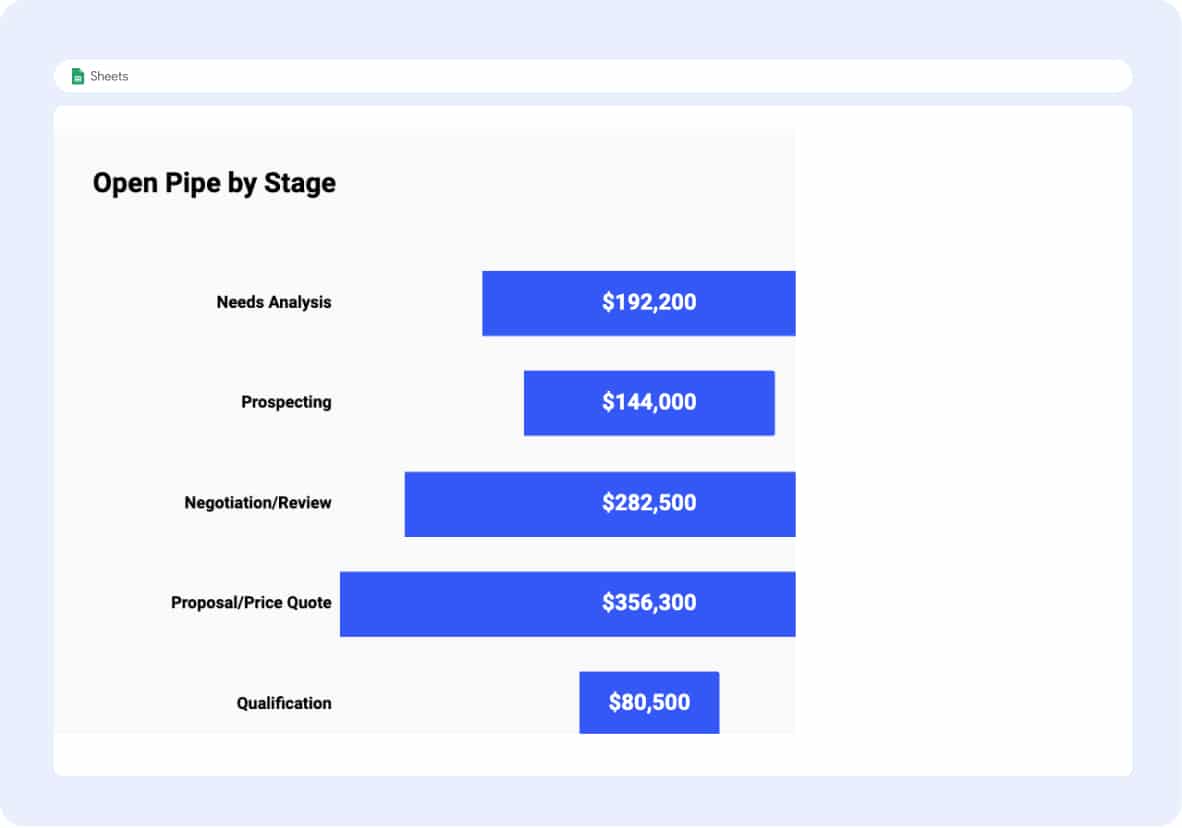
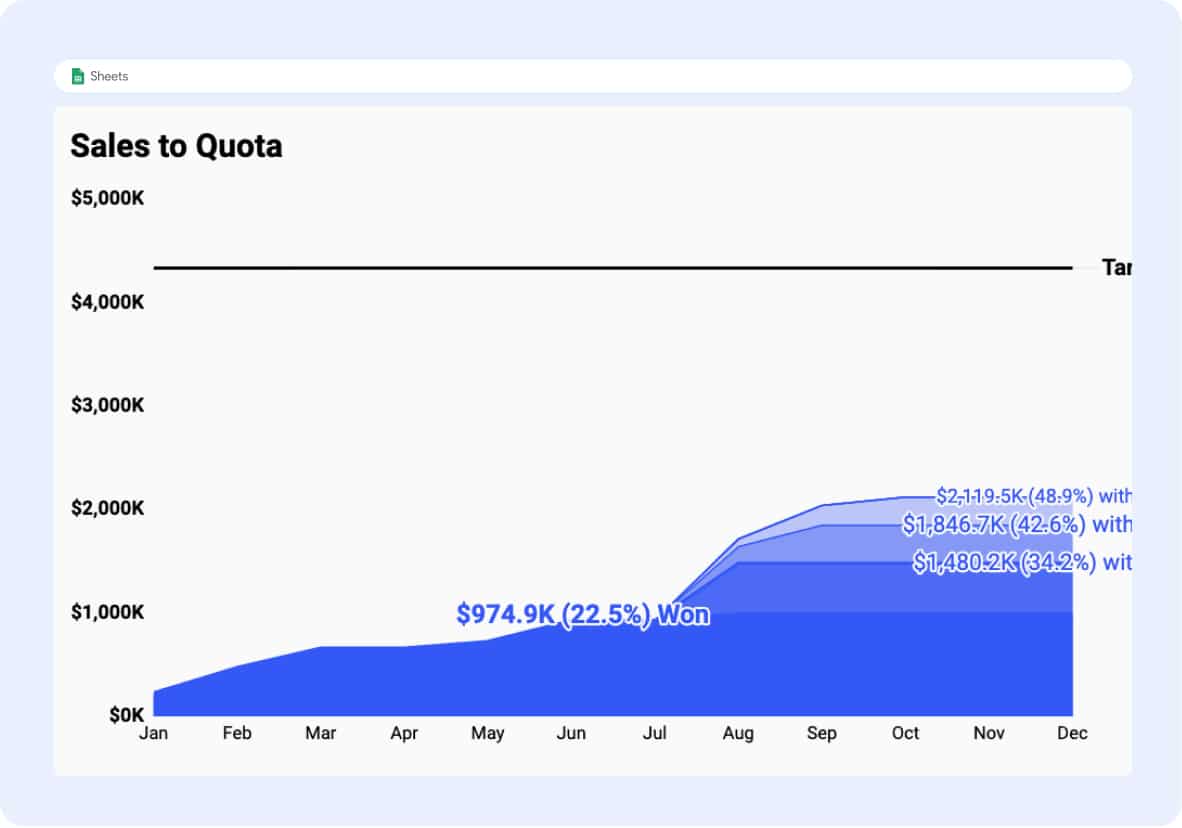
- Gain visibility into your opportunity pipeline by stage, for any month, quarter, or year — past, present, or future
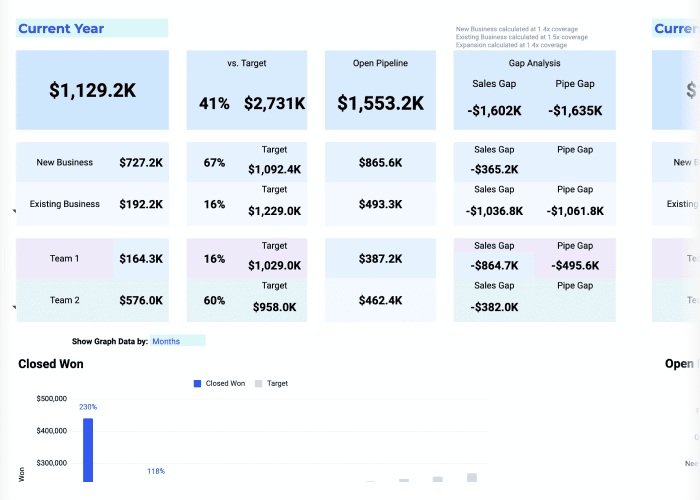
- Set individual and team quotas tied to pipeline volume and fluctuations
- Track monthly KPIs, such as win rate, average deal size, and value of each stage or forecast category
- Access a clean view of recent/upcoming opportunities, hyperlinked directly to their Sales Customer Relationship Management (CRM) software pages
- Receive notifications about important updates and changes in the pipeline
How to Do Opportunity Stage Forecasting?
Opportunity Stage Forecasting is a popular sales strategy that predicts the probability of an opportunity to close based on where the prospect currently is in your sales process.
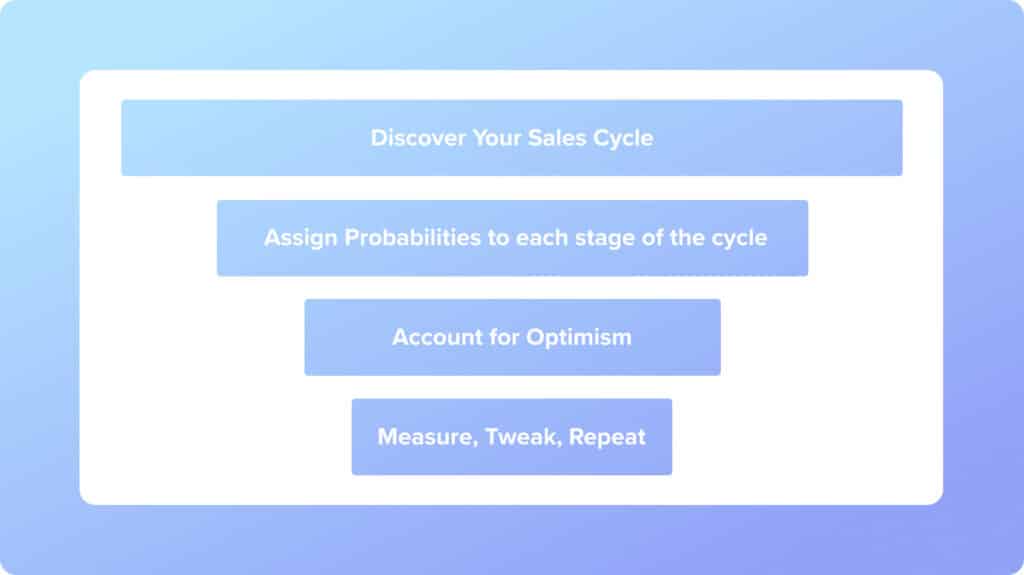
Here’s how to incorporate it into your SalesOps workflow:
- Discover Your Sales Cycle: First, you need to know the average length of your sales cycle. This involves mapping out the stages of your sales process from high-level awareness to a closed deal.
- Assign Probabilities to each stage of the cycle: This represents the likelihood of an opportunity to close within the current forecasting period. For example, you might assign a 20% probability to the ‘Appointment Scheduled’ stage, 40% to ‘Qualified to Buy’, 60% to ‘Presentation Delivered’, 90% to ‘Contract Sent’, and 100% to ‘Closed Won.’
Note: Not all opportunities are created equal. Not all opportunities are created equal. The likelihood that an opportunity in the ‘New Lead’ stage will close is significantly lower than an opportunity that has progressed 4 stages in your pipeline. Adjust accordingly.
- Account for Optimism: Sales reps often have a positive outlook that can skew their perspective on the likelihood of a deal closing. To counter this, clearly define ‘Commit’ standards and question opportunities before forecasting. Ensure your prospect has buying authority, confirmed start timeline, clear understanding of the purchase process, and a compelling reason to act now.”
- Measure, Tweak, Repeat: Once you begin opportunity forecasting, compare the forecast of your reps against their actual results. With time, adherence to the numbers, and a little coaching, you can build an accurate opportunity forecast that will serve your organization well.
What Is the Best Way to Track Sales Opportunities?
Sales opportunities represent potential deals that, when closed, contribute to revenue and sales team target achievement. Therefore, tracking sales opportunities effectively is important for measuring sales productivity.
The best way to track sales opportunities is by utilizing a comprehensive cloud-based or mobile CRM software system that offers a visual pipeline view. This allows you to see every opportunity within a pipeline, in the sales stage where it currently resides, and let you quickly view detailed contact information about each opportunity. This functionality also allows for effective lead management.
Here are some key steps to effectively track sales opportunities:
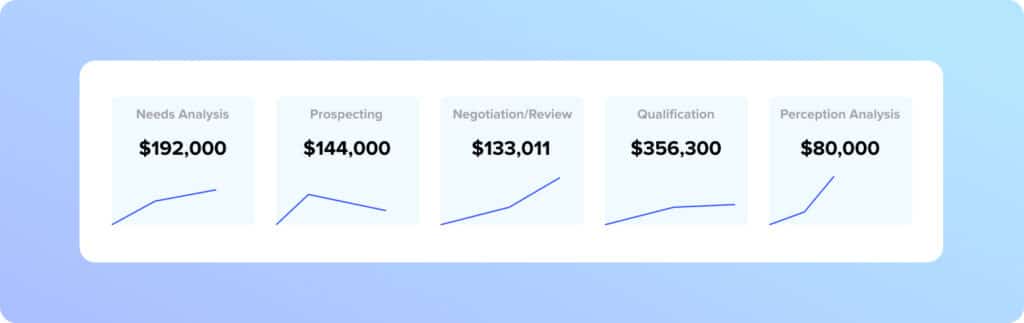
- Define Each Stage of Your Sales Process: As you learn more about your leads and they learn more about your business, they move from stage to stage in your sales tracking software. Each stage should bring opportunities closer to a sale.
- Prioritize Opportunities: Use data-driven insights to prioritize opportunities based on factors such as deal size, likelihood of closing, and strategic value to the company.
- Automate Tasks: Automation features in CRM tools can save considerable time and reduce errors. For instance, tasks can be automatically created as you move an opportunity into the next sales pipeline stage.
- Use Reports and Analytics: Automate sales tracking on a spreadsheet or use a software to evaluate the effectiveness of your sales opportunity tracking. Looking at the customer data in your sales CRM software can reveal a lot about your customers and your sales cycle and inform future strategies.
How to Set Sales Quotas by Team and Rep?
Setting sales quotas is a strategic process that aligns sales targets with business objectives and market conditions. Here are seven concise steps to effectively set sales quotas for your team and individual salesperson:
- Identify Your Resources: Start with a sales quota calculator and template. This will help you understand your drop-off rates, conversion rates, and give you a full picture of your sales pipeline. This insight will help you set realistic monthly and quarterly goals.
- Choose an Appropriate Sales Quota Strategy: There are five main strategies to consider: volume-based, activity-based, profit-based, cost-based, and combination strategy. The best strategy for your team depends on various factors, including your industry, the size of your business, and your business objectives.
- Choose How to Set Your Quota: There are two main ways to implement your quota system: top-down and bottom-up approaches. The top-down approach is set by senior-level stakeholders based on the organization’s objectives. The bottom-up approach is set by the sales manager who analyzes each sales rep’s capabilities, past performance, and market opportunity to create realistic goals.
- Establish a Baseline: The baseline is the minimum number of sales you need to make to stay in business. This figure acts as the foundation to build a realistic sales quota. Factors to consider when coming up with your baseline include historical sales, seasonality, and market influences.
- Calculate Your Sales Quota: Once you have a baseline figure, set a quota that represents growth. For example, if your baseline is $80,000 per month, 10% growth will give you a sales quota attainment of $88,000 per month.
- Determine Your Review Period: Your review period depends on the length of your sales cycles. Typical review periods include weekly, monthly, or quarterly. A short review period can help you identify problems and take corrective measures before the end of the quarter.
- Communicate Performance Expectations: After a thorough review of your sales quota, communicate performance expectations to the sales reps. Share the specific number, as well as the rationale behind the figure. Additionally, speak to the sales reps about how you will measure their performance.