Free, pre-built Sales Performance Dashboard in Google Sheets
Help your sales team celebrate their hard work by sharing results on year-over-year growth. Keep track of which regions, industries, or accounts had the most yearly sales.
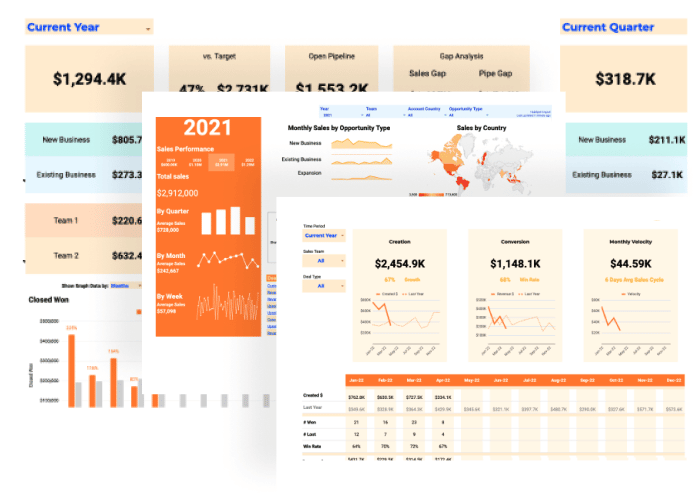
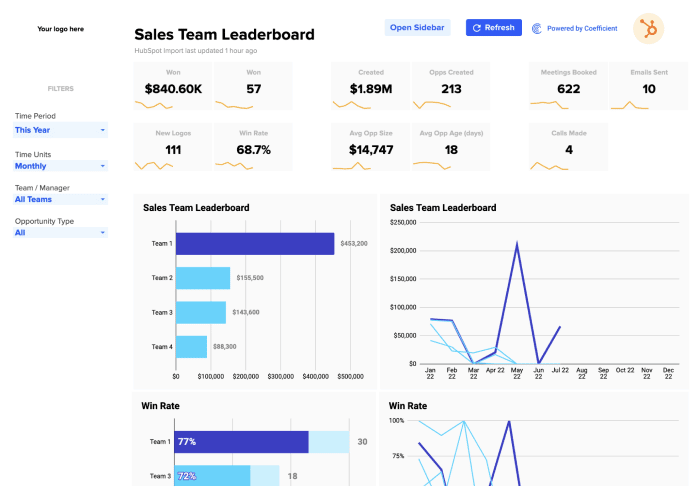
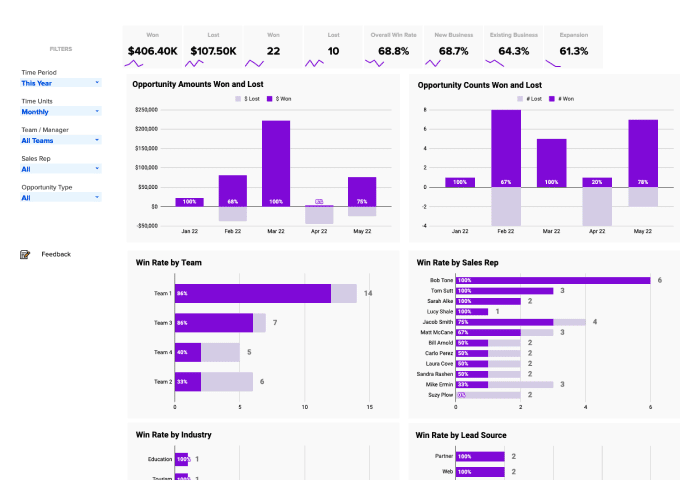
This template makes it easy to slice and dice your sales reporting data by sales team, deal type, and other key filters. Keep your sales department organized with real-time data on sales performance results on a beautiful, modern dashboard template. Automatically populate this dashboard with live data from your HubSpot CRM.
What’s included in this template:
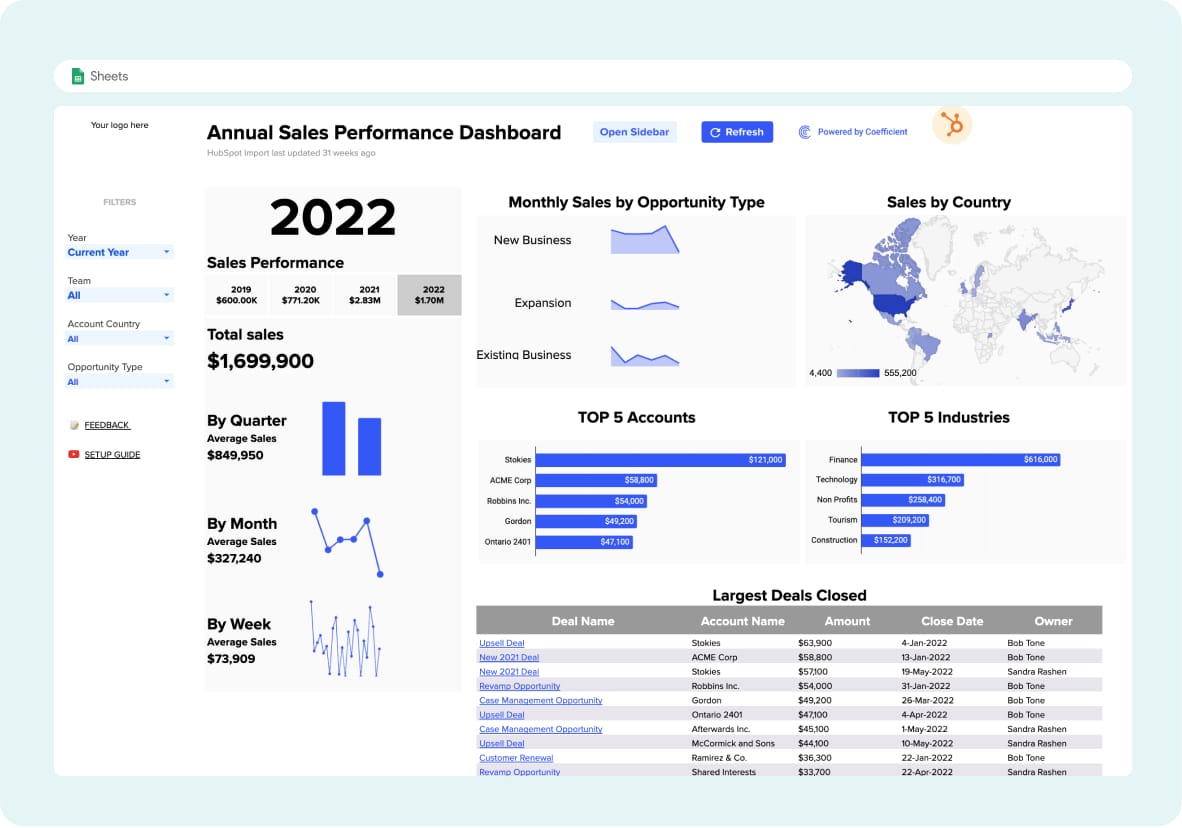
- Annual Sales Performance: View a summary of period-over-period Sales results segmented by opportunity type, sales by country, top 5 industries and accounts, and the largest deals closed
- Pipeline Analysis: Analyze key sales metrics such as pipeline creation, conversions, velocity, win rates, and more
- Sales Targets: Set monthly or quarterly sales targets by company, team, and individual to monitor attainment
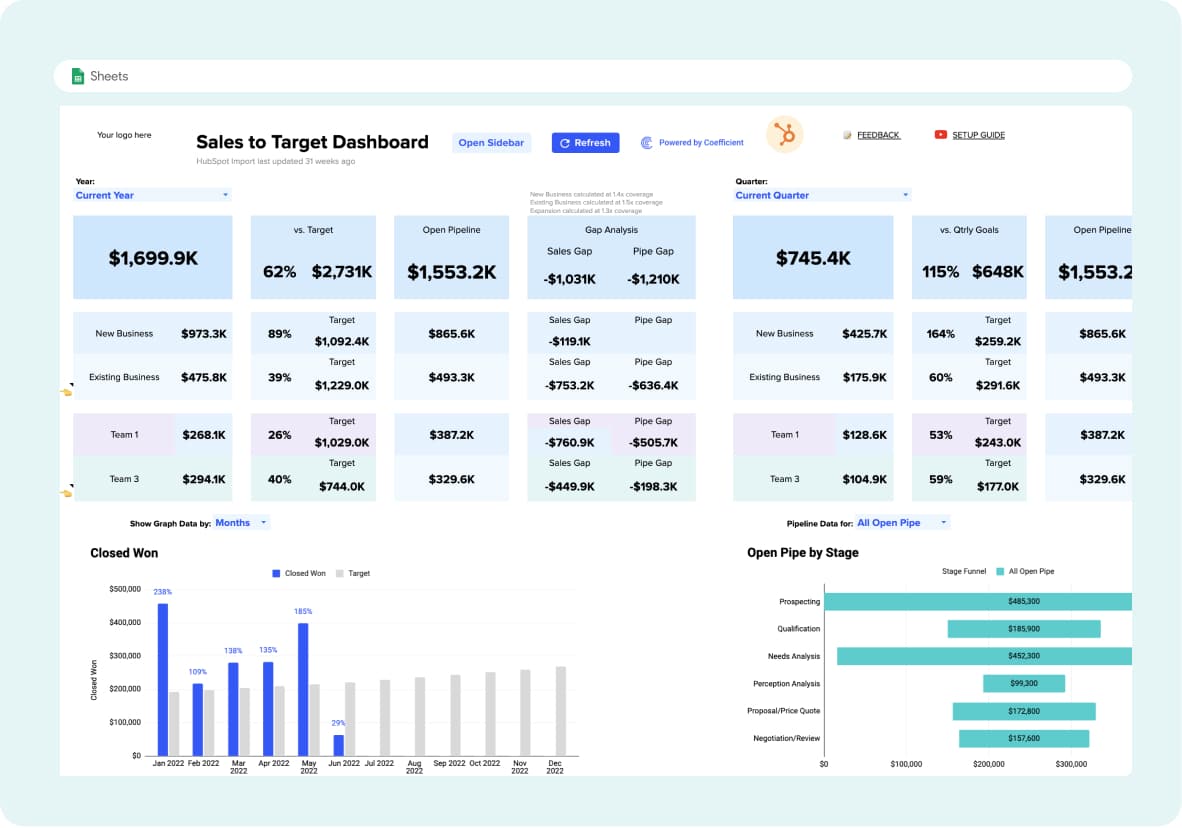
- Sales to Target: Visualize planned versus actualized performance by specific teams, individuals, or time periods
Must-Have Sales Analytics KPIs and Why?
Sales analytics Key Performance Indicators (KPIs) are essential for understanding how your sales team and individual sales representatives are performing and where there are opportunities for improvement.
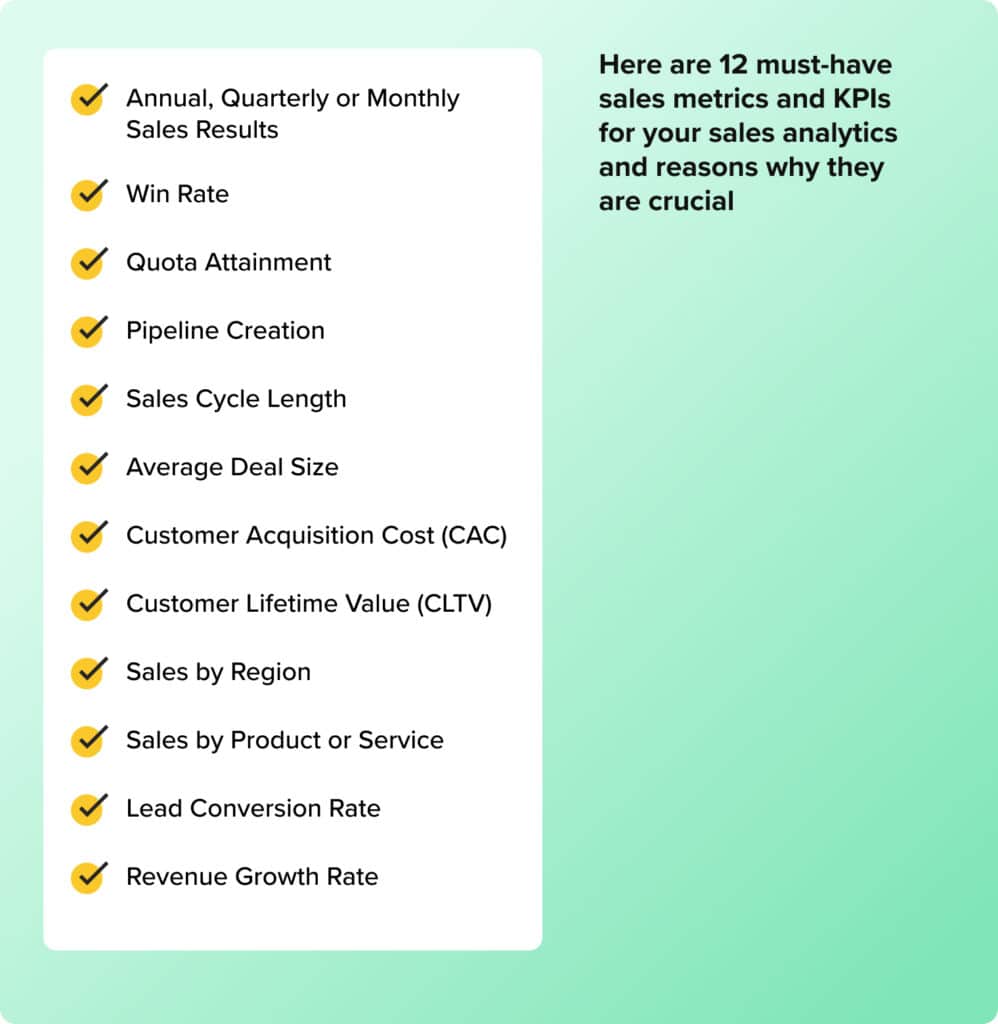
Here are 12 must-have sales metrics and KPIs for your sales analytics and reasons why they are crucial:
- Annual, Quarterly or Monthly Sales Results: Evaluate the overall performance and effectiveness of your sales team. It helps in tracking progress against revenue goals and in making strategic decisions.
- Win Rate: Measure the percentage of opportunities that result in a closed-won deal. It’s vital to understand the efficiency of your sales team and can provide insights into the quality of leads and sales process.
- Quota Attainment: Measure the number of salespeople meeting or exceeding their sales targets. It’s a clear indicator of individual and team performance and can highlight areas for improvement.
- Pipeline Creation: Track the number of new prospects or leads entering your sales pipeline. It can indicate the effectiveness of your marketing efforts and helps predict future sales.
- Sales Cycle Length: This is the period of time it takes for a lead to move through your sales pipeline and become a customer. It’s important for forecasting and resource planning.
- Average Deal Size: This KPI gives insight into the typical value of your deals. It can help in identifying trends, understanding your market position, and focusing on the most profitable opportunities.
- Customer Acquisition Cost (CAC): This is the total cost of acquiring a new customer, including all aspects of sales and marketing. It’s essential for understanding profitability and efficiency of sales and marketing efforts.
- Customer Lifetime Value (CLTV): Measure the total worth of a customer over their lifetime. It’s crucial for identifying the most valuable customer segments and focusing retention efforts.
- Sales by Region: This KPI helps you understand market penetration and opportunities in different geographical areas.
- Sales by Product or Service: Identify your best-performing and worst-performing products or services. It can provide valuable insights for product development and marketing efforts.
- Lead Conversion Rate: Measure the percentage of leads that convert into customers. It helps assess the effectiveness of your sales team members and lead quality.
- Revenue Growth Rate: Measure the rate at which your company’s sales revenue is increasing. It’s essential for evaluating long-term sustainability and success.