
If you manage a business with any online presence, then you’ve likely heard about the value of Google Analytics.
While there are many competing tools on the market, Google Analytics is one of the most widely used platforms because it provides an industry standard for online traffic analysis.
Data even shows that at least 28,832,505 active websites use Google Analytics, highlighting how powerful and useful the tool is for many users.
Google Analytics gives you a comprehensive amount of real-time, actionable, vital data about your customers’ behavior.
Plus, you can use data from Google Analytics to drill down and get more insights to bolster your sales, marketing, and customer service efforts.
In this guide, we’ll cover how to connect Google Analytics to Google Sheets seamlessly to simplify creating traffic reports, dashboards, and snapshots. Get started fast with this pre-built Google Sheets template powered by your live GA data.
Video Walkthrough: How to Connect Google Analytics to Google Sheets
How to use Google Analytics in Google Sheets
There are endless ways to use your Google Analytics data within Google Sheets. Some of the common use cases include the following.
Build dashboards with embedded data visualizations
Google offers a myriad of visualization tools out of the box, which you can make the most of when your data is in a Google spreadsheet.
You can also embed Google spreadsheet graphs and charts into external sites easily. This allows you to create dashboards and visualizations from your Google Analytics data and host them in your preferred channels.
The visualizations can update on the fly when you run your reports or when you auto-update your import datasets, allowing you to automate your sales reporting (among others).
Query data from various views
The Google Analytics web interface shows you visualizations and reports one view at a time.
However, using your Google Analytics data within Google Sheets allows you to run reports on any number of views and you can use the generated data in any way you prefer.
For example, if you want a single view of your Android and iOS traffic, you can create a side by side visualization showing both data in Google Sheets. This allows you to see and easily compare information from both, since you can view them side by side within the same spreadsheet.
Create custom calculations from your Google Analytics data
Google Analytics collects numerous data types and it gives you several choices for reporting.
However, some data might require calculations that are not always possible with the Google Analytics platform alone.
When your data is in Google Sheets, you can use the program’s built-in data manipulation functions and features.
This allows you to get granular with your data analysis, simplifying your reporting processes and helping you streamline how to build a marketing dashboard in Google Sheets.
Auto-update your data and visualizations
You can configure the data that feeds into your visualizations and charts (Google Analytics data imported to Google Sheets) to auto update so your dashboards always show real-time data.
Simplify and control who sees your Google Analytics data
The Google Analytics platform offers excellent, bird’s-eye view insights into your data. However, you might want to share your data and insights with stakeholders without giving them access to your Google Analytics account.
Using your Google Analytics data in Google Sheets addresses the issue since you can easily create visualizations and reports and configure access through Google Sheet’s built-in permission system.
With the future of Google Sheets and connected spreadsheets, you can easily limit or grant permission to the data within each spreadsheet without providing access to your entire Google Analytics account.
Can you connect Google Analytics to Google Sheets?
There are several methods to pull up your data from Google Analytics to your Google spreadsheet.
For instance, you can export a file directly from Google Analytics. However, this poses several limitations, such as the inability to export any real-time reports, Experiments, or Lifetime Values.
You can only save Flow reports as a PDF, which doesn’t allow you to manipulate the data unless you physically copy it back into a spreadsheet. All these require manual methods that you have to repeat each time you produce a report.
The good news is there are better, streamlined options to move Google Analytics data to Google Sheets. With these options, you’ll have continuous access to your data and the freedom to manipulate it based on your unique business needs.
Why connect Google Sheets to your Google Analytics
While Google Analytics provides a lot of useful tools on its own, it has a few caveats when you try to use it for reporting.
For example, the user reviewing the data needs to have access to your Google Analytics Dashboard. While you might be okay with this, it also requires the user to understand how to navigate the tool and to understand what they’re looking at.
Pulling up Google Analytics data into Google Sheets allows you to build a customized dashboard for your users to view, allowing them to see only the data they care about.
It also makes managing access to that dashboard significantly easier since your organization can leverage the security and access tools already built into the Google Workspace.
Additionally, importing Google Analytics data into Google Sheets allows you to correlate data between multiple sources.
It may be comparing the click rates on two different Mailchimp campaigns against the bounce rates in Google Analytics; or looking into data on purchases from your storefront, and seeing if that advertising money you spent on Google or Bing really resulted in enough sales to be worth redoing in the future.
You’re better off analyzing, visualizing, and tracking these information through comprehensive dashboards, which can be challenging with Google Analytics alone. This makes it crucial to connect Google Sheets to Analytics to simplify creating your reports and dashboards.
TL;DR: Coefficient provides the best method to connect Google Analytics with Google Sheets
Data shows that professionals spend 50% of their time looking for data. That’s 50% of your employee’s productive time you can take back by streamlining the data reporting, analysis, and tracking.
This is where Coefficient comes in handy.
Using Coefficient is the easiest and most intuitive method for getting your Google Analytics data into Google Sheets.
While both solutions support importing data into Google Sheets and running recurring reports, only Coefficient allows you to do this with multiple data sources with ease.
Why would you want to use two or three or four tools to import your data, when you can use just one?
Through the Coefficient data connector app, you can connect Google Analytics as your data source, configure your data import, set up an auto-refresh schedule, and you can pull all your datasets to Google Sheets almost instantly.
You won’t need to download and export a CSV file or map objects and data fields, taking away the complexities and time-consuming aspects of moving data from Google Analytics to Google Sheets.
On top of this, Coefficient also supports capturing data snapshots to help you visualize how your data changes over time.
The Options
Below are a few of the best ways to connect your Google Analytics data to Google Sheets.
1. Coefficient
Using a Google Analytics add-on is one of the common methods for moving Google Analytics data into Google Sheets.
However, this is often a complex and tedious undertaking since you’ll need to aggregate and sort data and set up the necessary configurations and parameters before importing. This can be challenging and involves a long learning curve for non-technical users.
The user interface of some add-ons also pose some accessibility challenges, such as a lack of color and micro UX both in the setup process and the output spreadsheet.
All these factors can make moving data error-prone and it could be challenging to navigate through the process easily.
Coefficient provides a much better solution, allowing you to pull up data from Google Analytics into Google Sheets without any of the complexities mentioned above.
Follow these steps:
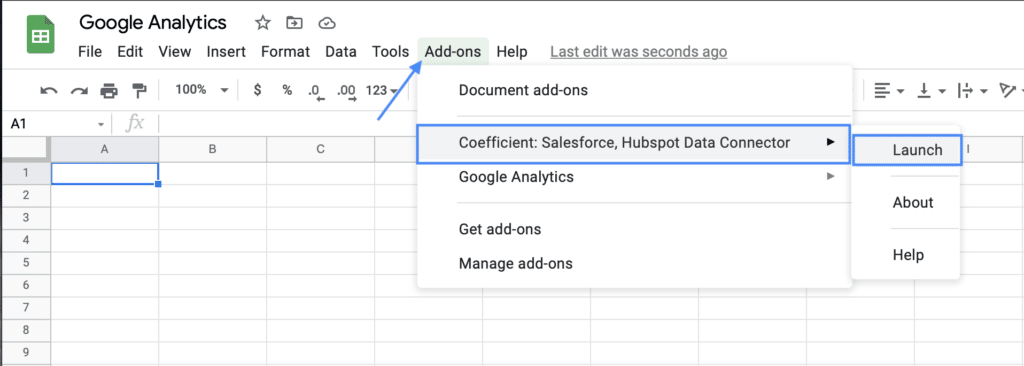
Step 1: On your Google spreadsheet, navigate to the Add-ons dropdown in the top menu, select Coefficient, and click Launch.
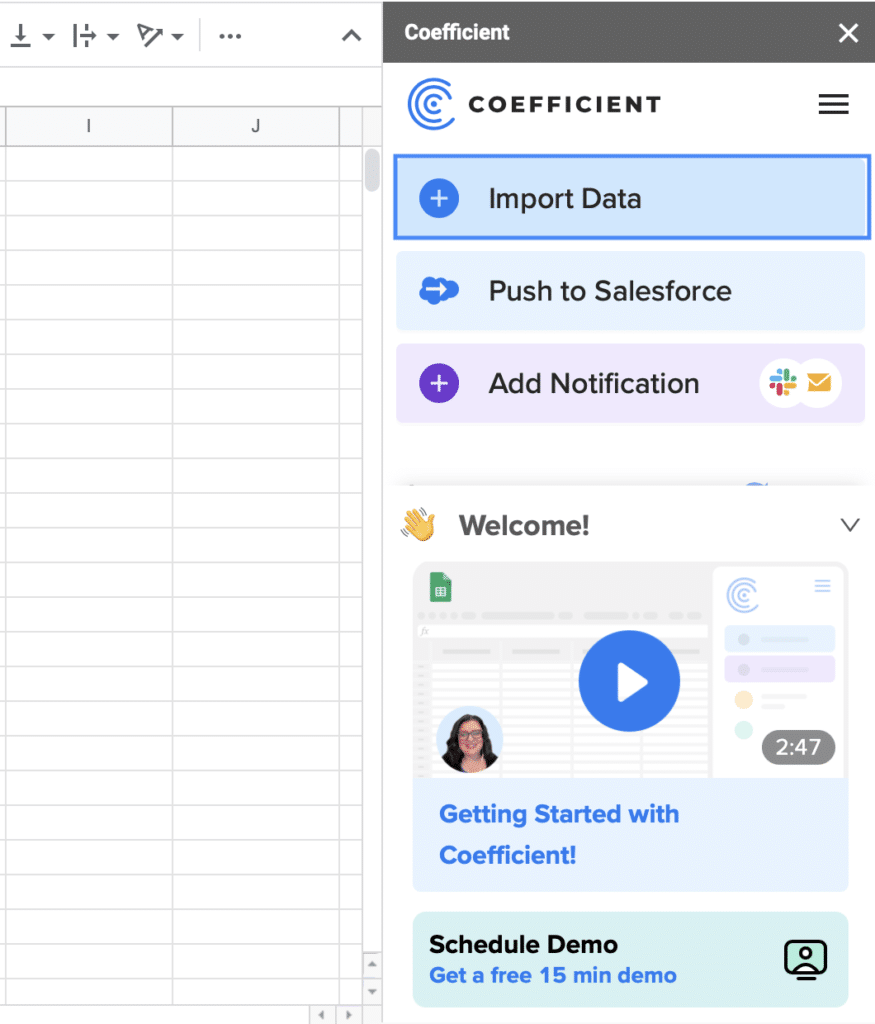
This opens the Coefficient sidebar on the right side of the interface. Select Import Data.
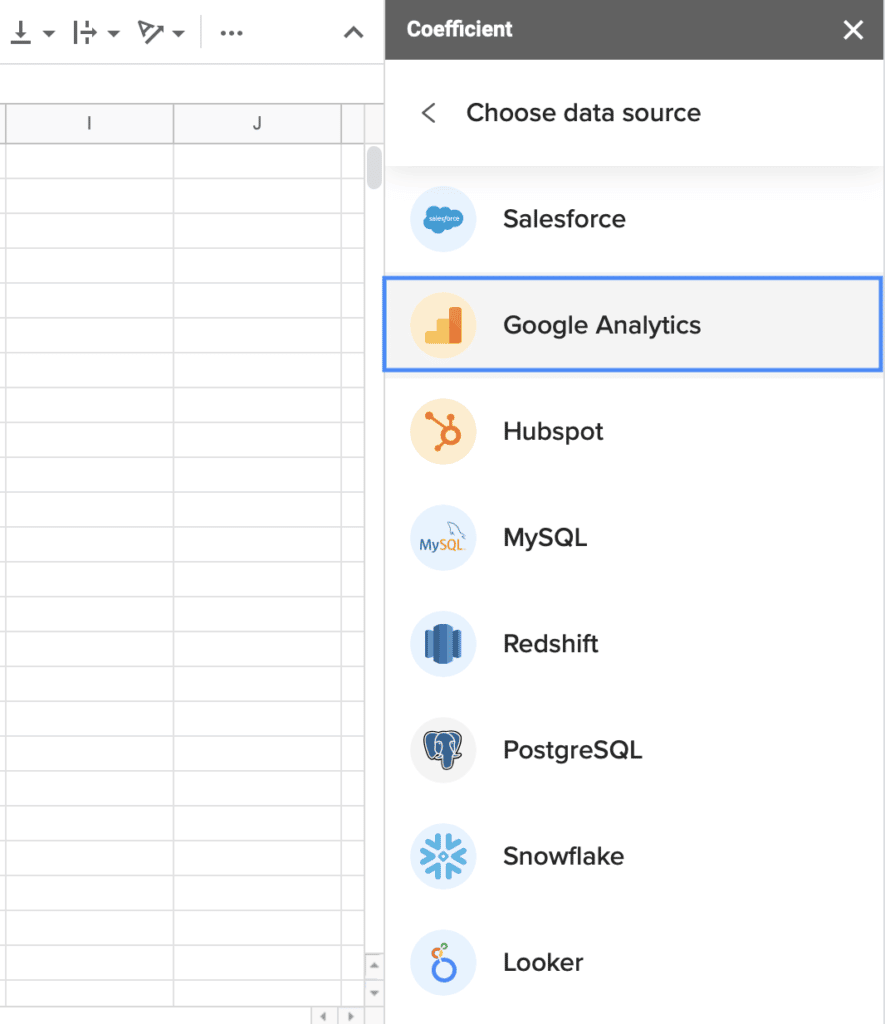
Choose Google Analytics as your data source.
Note: You can pull up data from other platforms and sources along with your Google Analytics data.
Step 2: From the segmented, color-coordinated menu with your import options, select your view (the website you’d like to pull up data from).
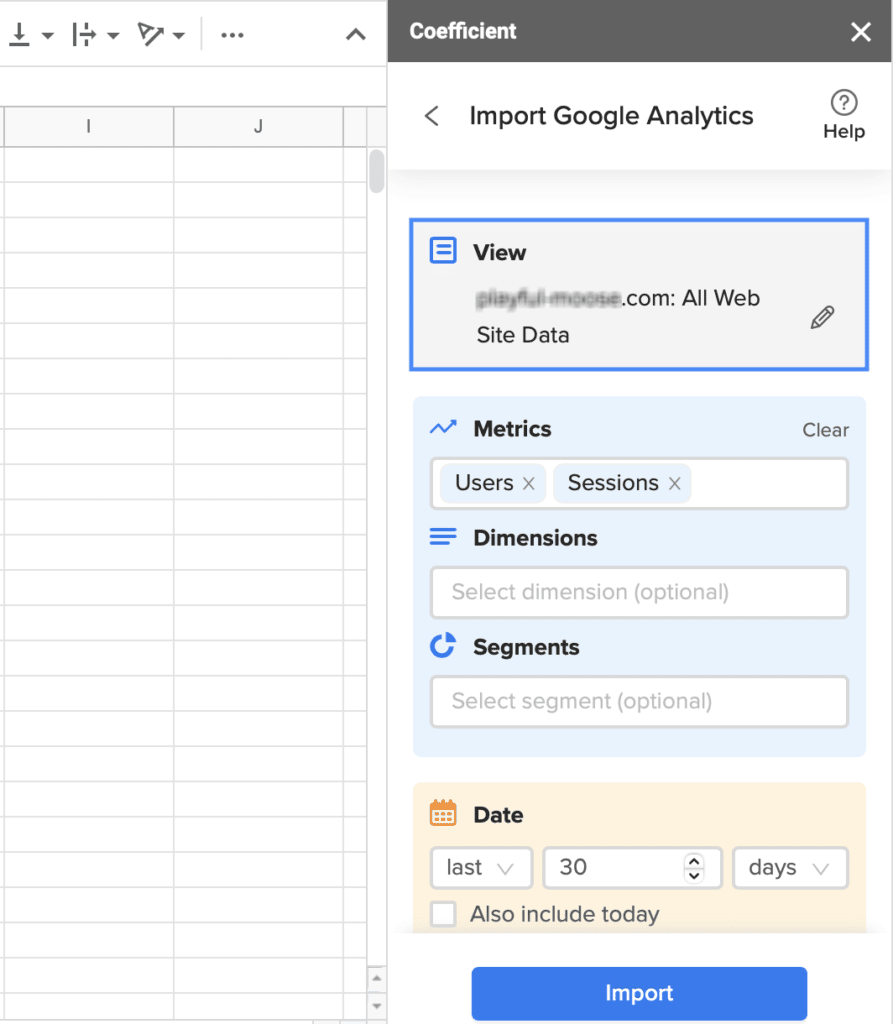
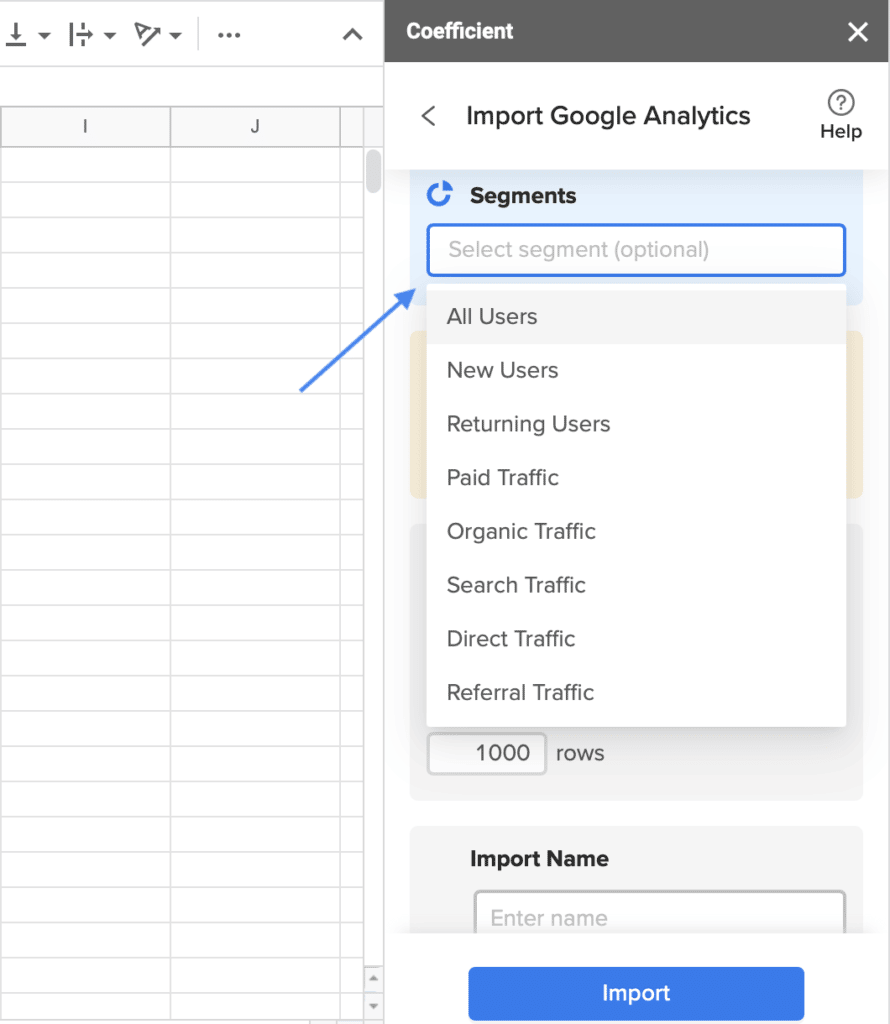
Step 3: Choose your metrics, which are the criteria of your report. You can choose more than one and include Dimensions and Segments (both optional).
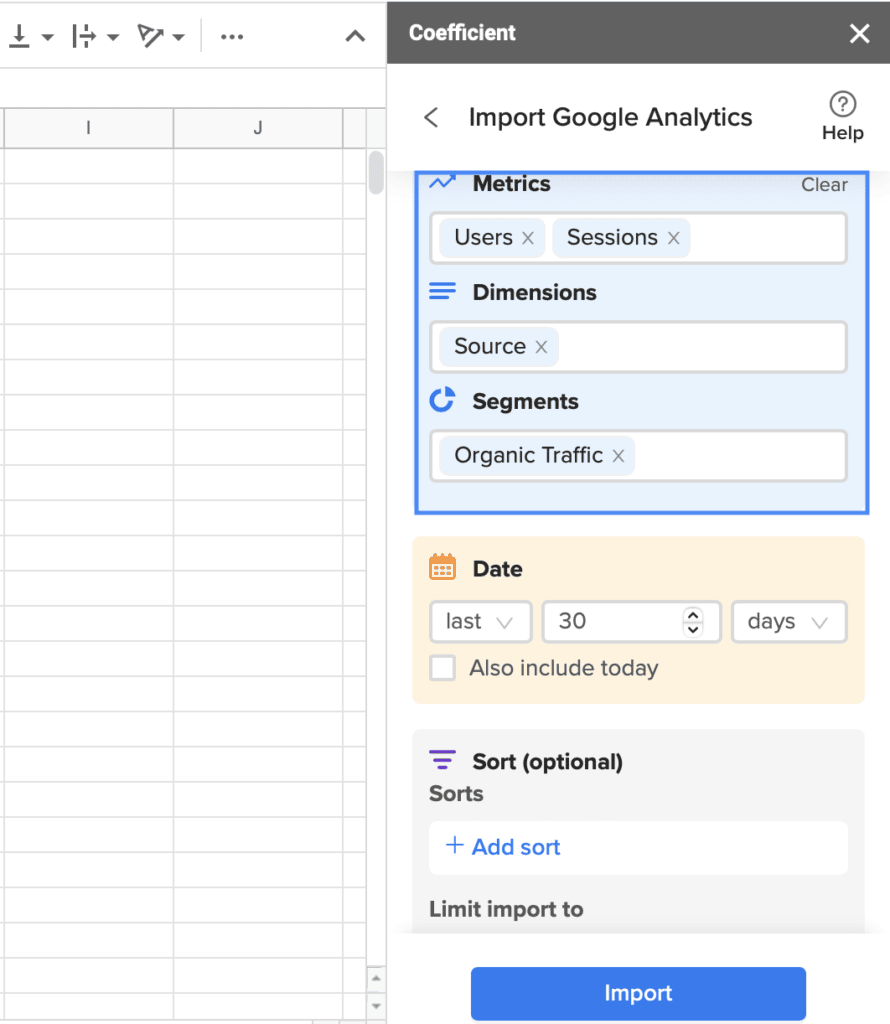

Stop exporting data manually. Sync data from your business systems into Google Sheets or Excel with Coefficient and set it on a refresh schedule.

Note that these also come as a useful dropdown where you can select and autofill parameters.
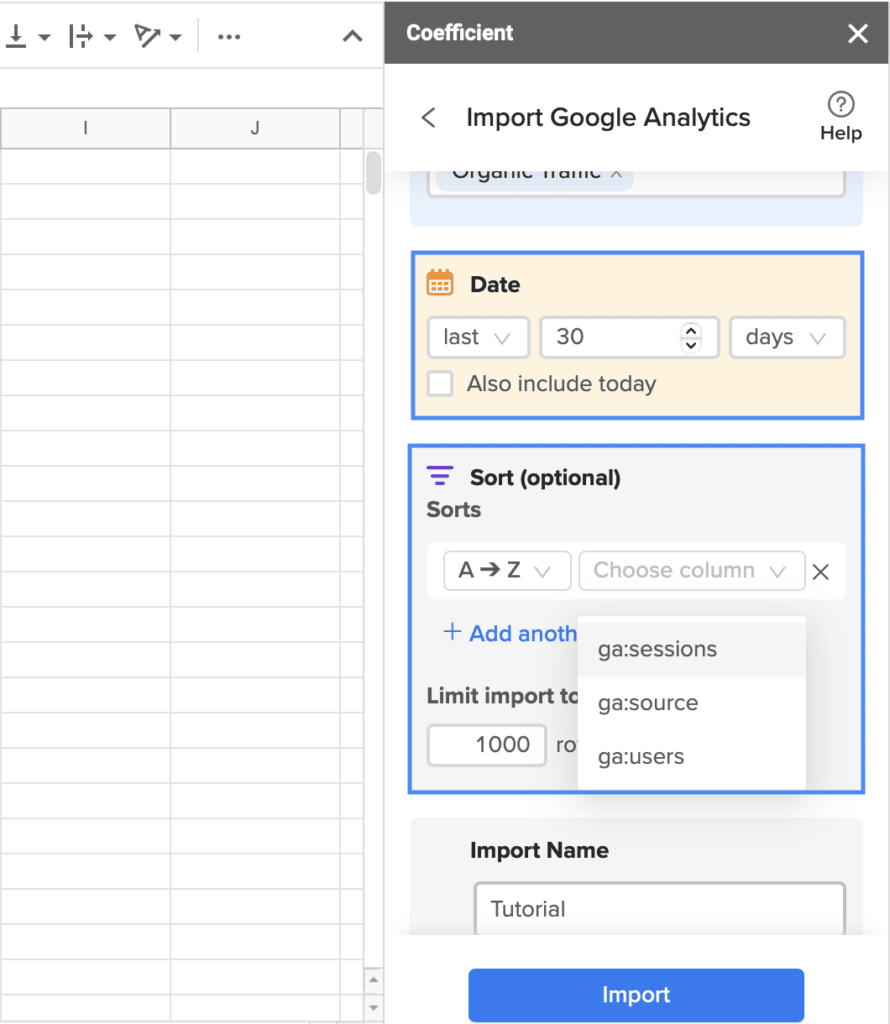
Step 4: Provide the date range of how far back you want to go with your data. You can use the sort function and name your import from here.
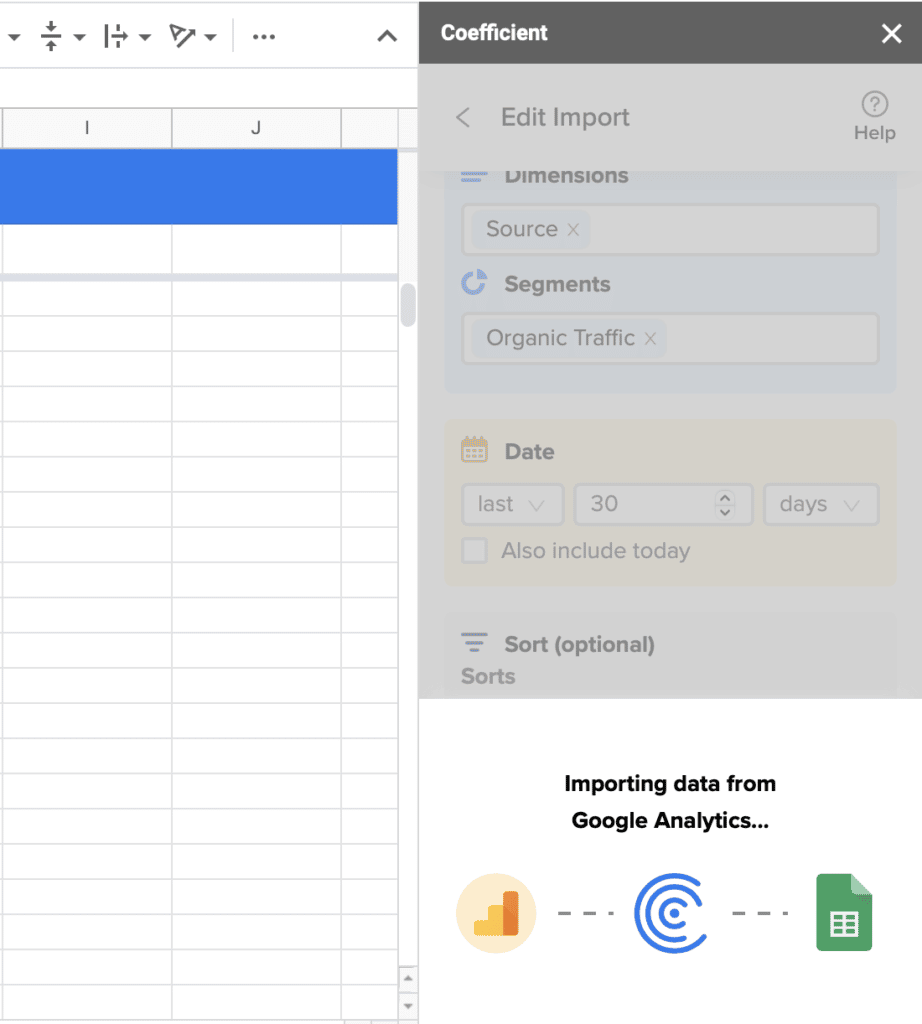
Step 5: Click Import and you should be able to see the Google Analytics data on the active spreadsheet. This can take a few minutes depending on the import data size.
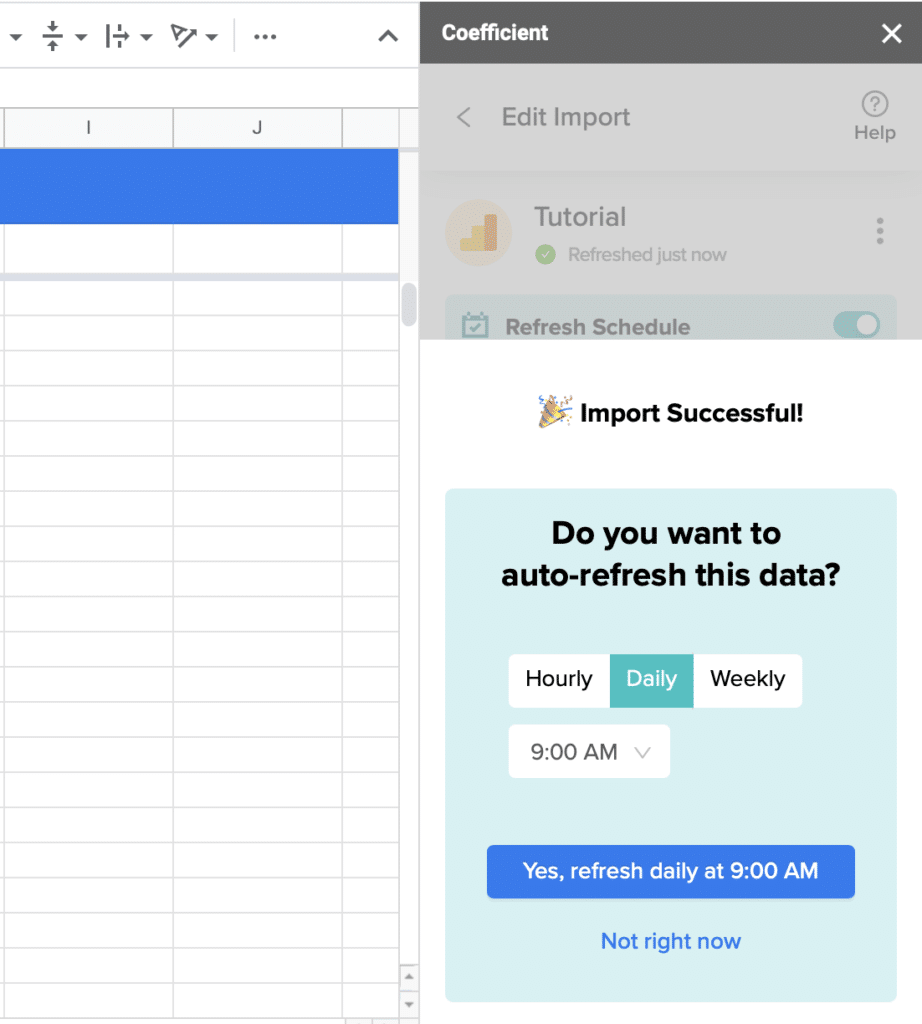
Step 6: Once the import is done, you’ll see the prompt and options to schedule your data to auto-refresh hourly, daily, or weekly.
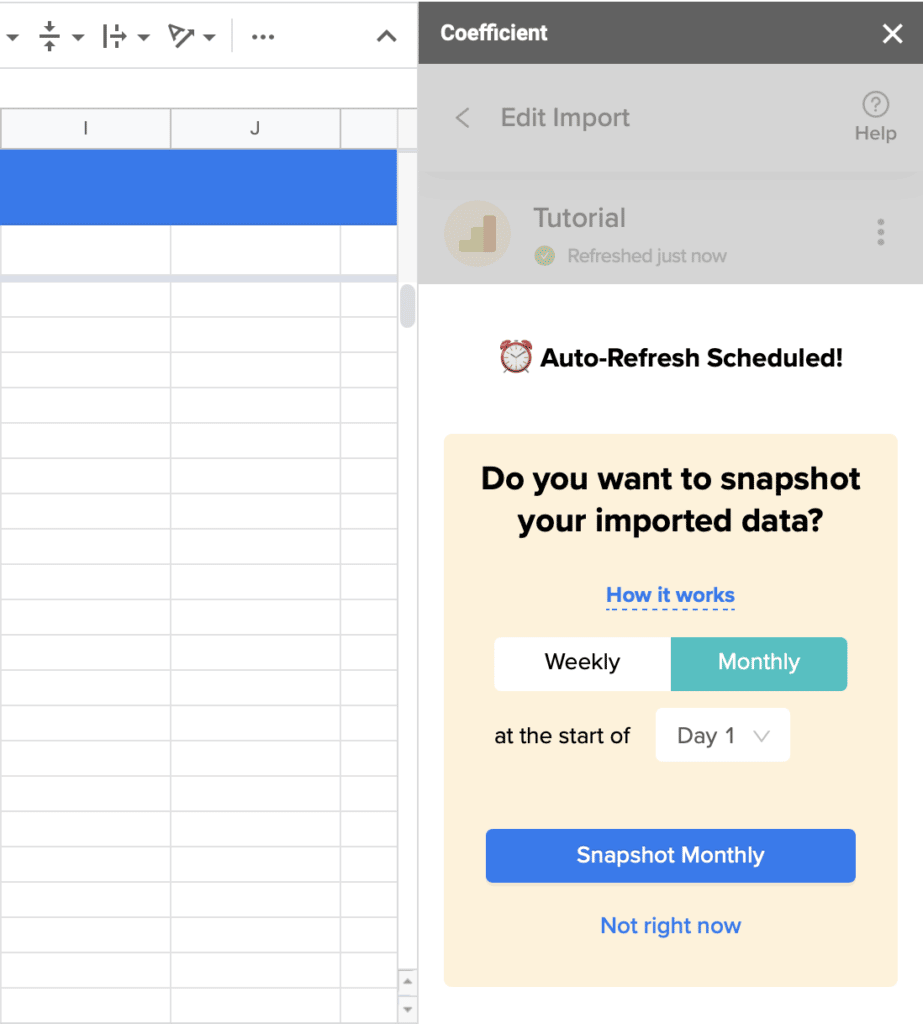
Step 7: Configure auto snapshots of your import data weekly or monthly. It’s a function that doesn’t exist in the Google Analytics Spreadsheet add-on.
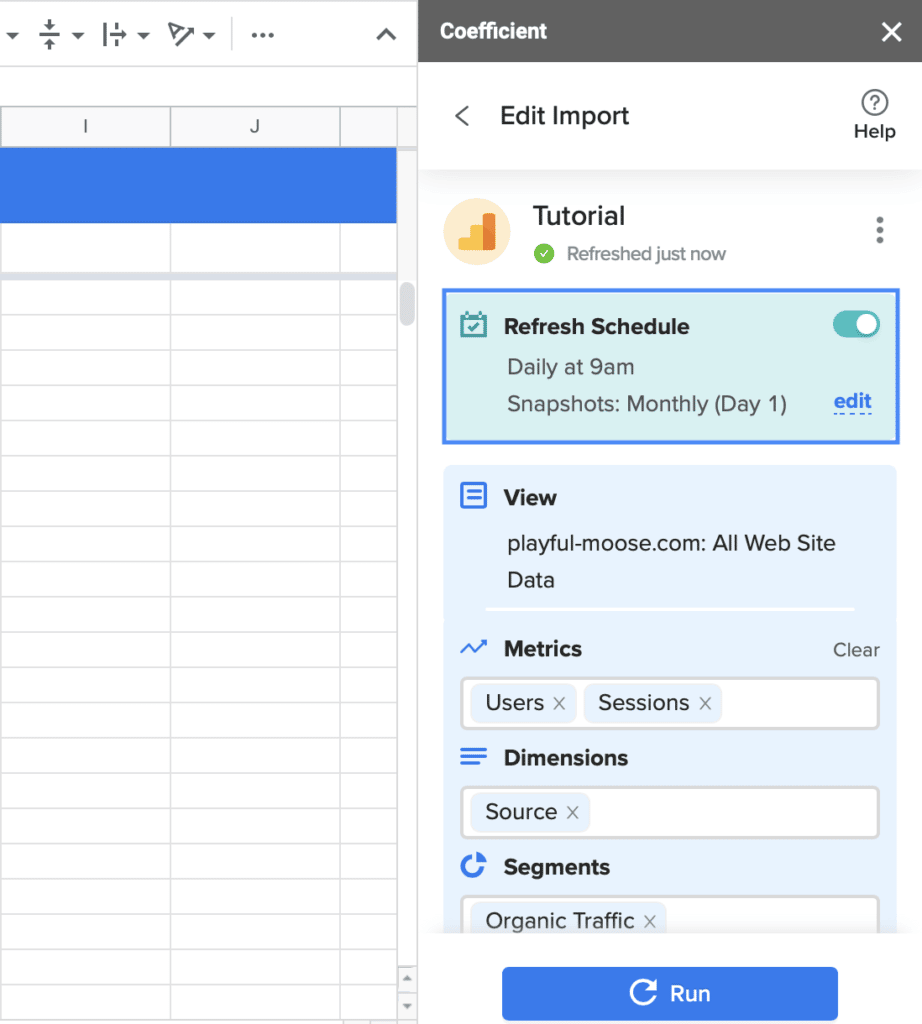
You can easily disable snapshotting and auto-refreshing and edit the frequency at any time. You can access these options at the top right-hand side of the Coefficient sidebar menu.
You’re all set.
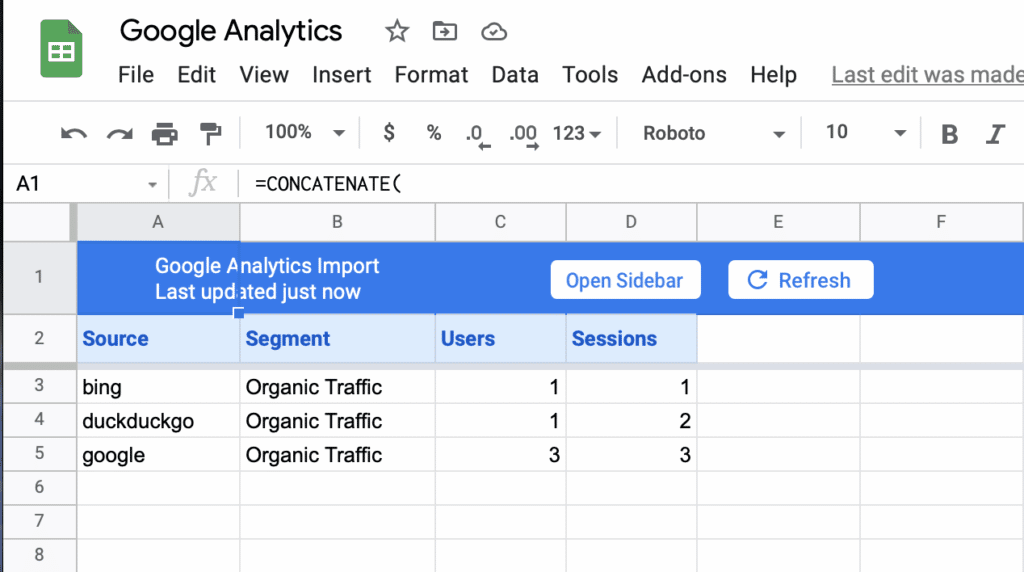
Here’s a simple, easy-to-understand sample report based on the parameters we entered with no extra fields, but only the data you need.
2. Google Analytics add-on for Google Sheets
Let’s go through the step-by-step process of installing and using the Google Analytics Spreadsheet add-on within your Google Docs.
Step 1: Open your Google Docs and navigate to Sheets. Name your file (if you haven’t yet), select Add-ons from the menu.
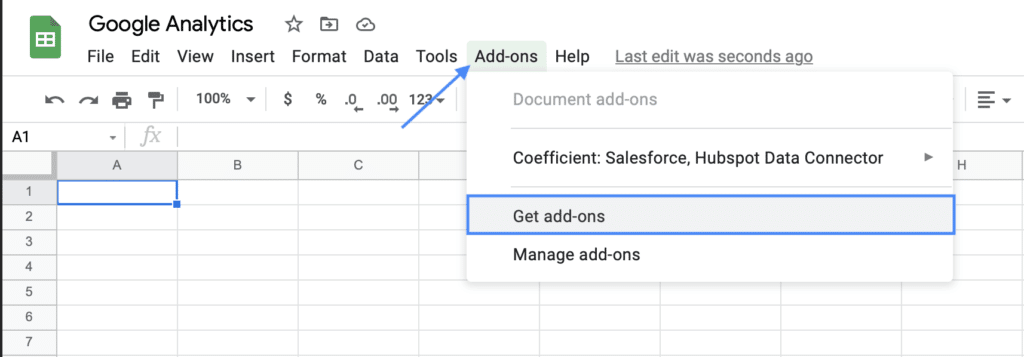
Click Get add-ons, and this should open the Google Workspace Marketplace where you can find the Google Analytics Sheets Add-on.

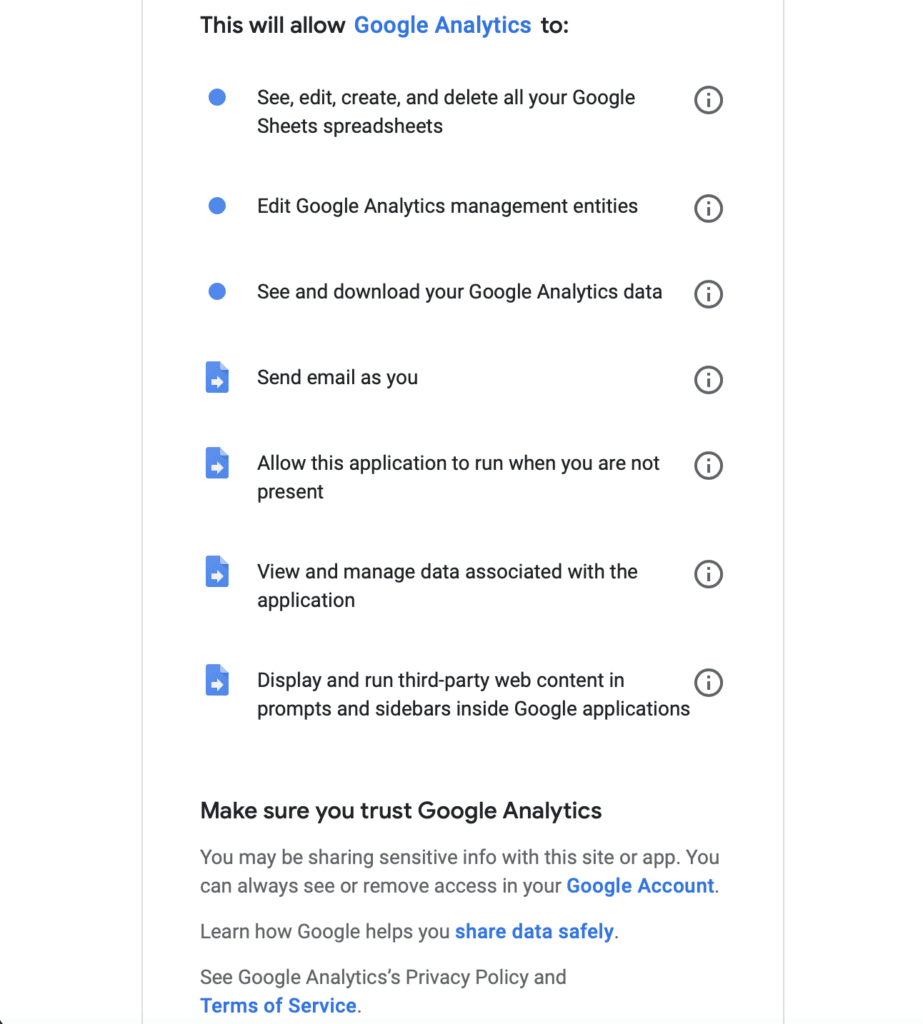
Choose Google Analytics and accept the access agreements necessary for the add-on to work.
Now that your plugin is installed, let’s make our first report.
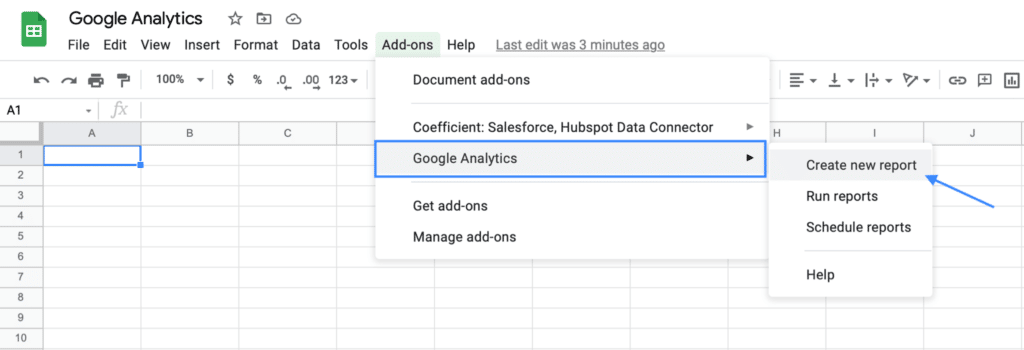
Step 2: Select Add-ons from the menu then Google Analytics from the dropdown. Click Create new report.
Step 2: Configure your import data and add the required information.
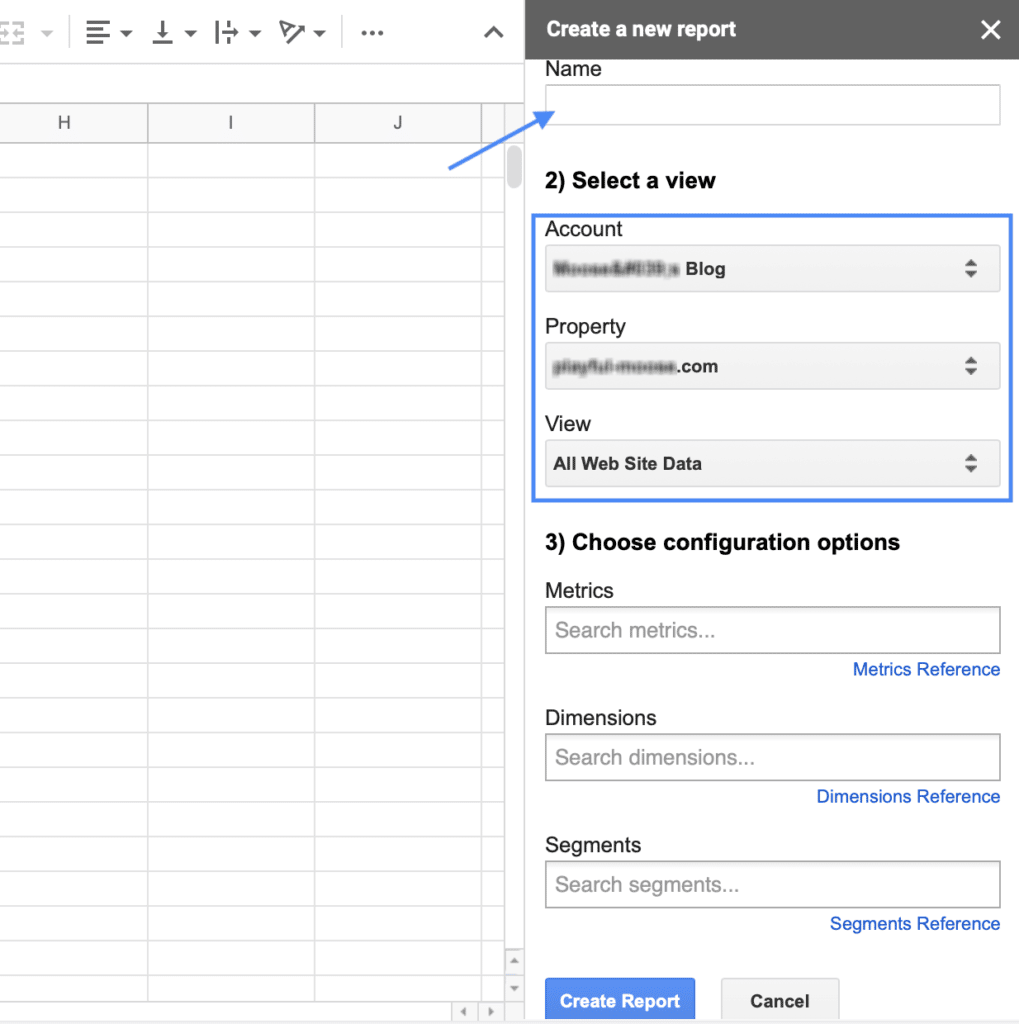
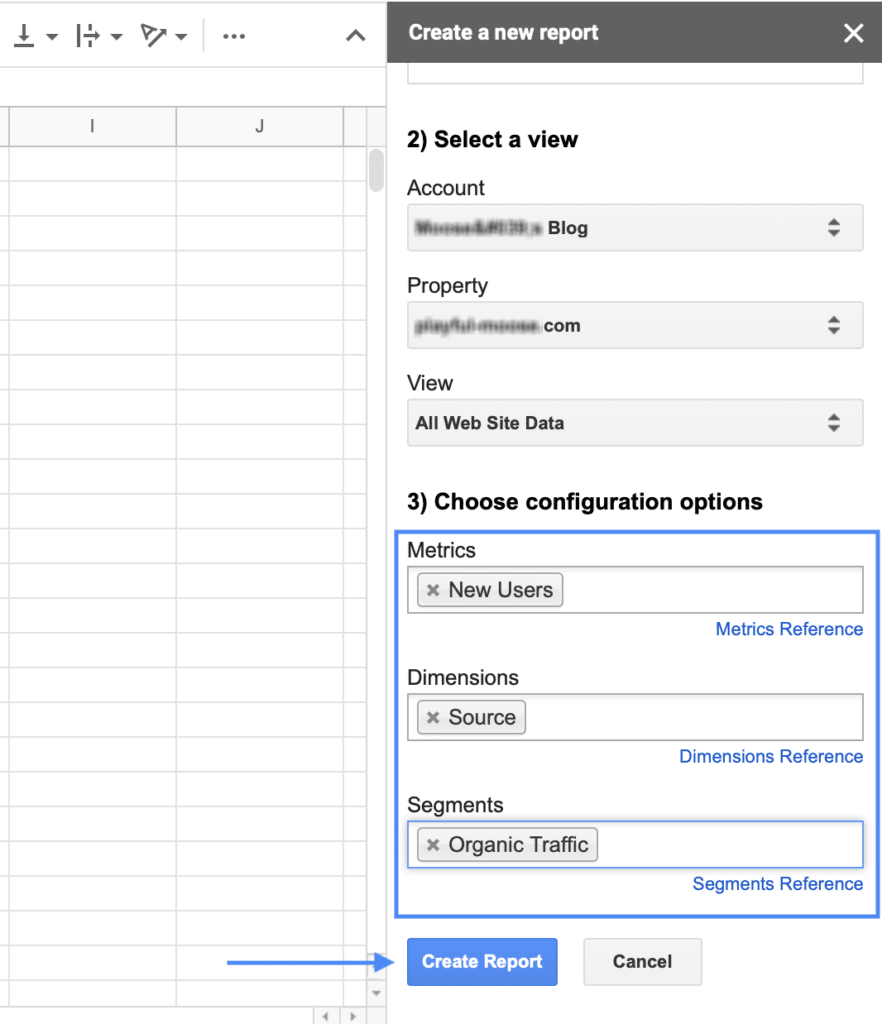
Name your report, select the source (which is especially useful when you manage multiple sites or use landing pages), and define the data pool you want to use.
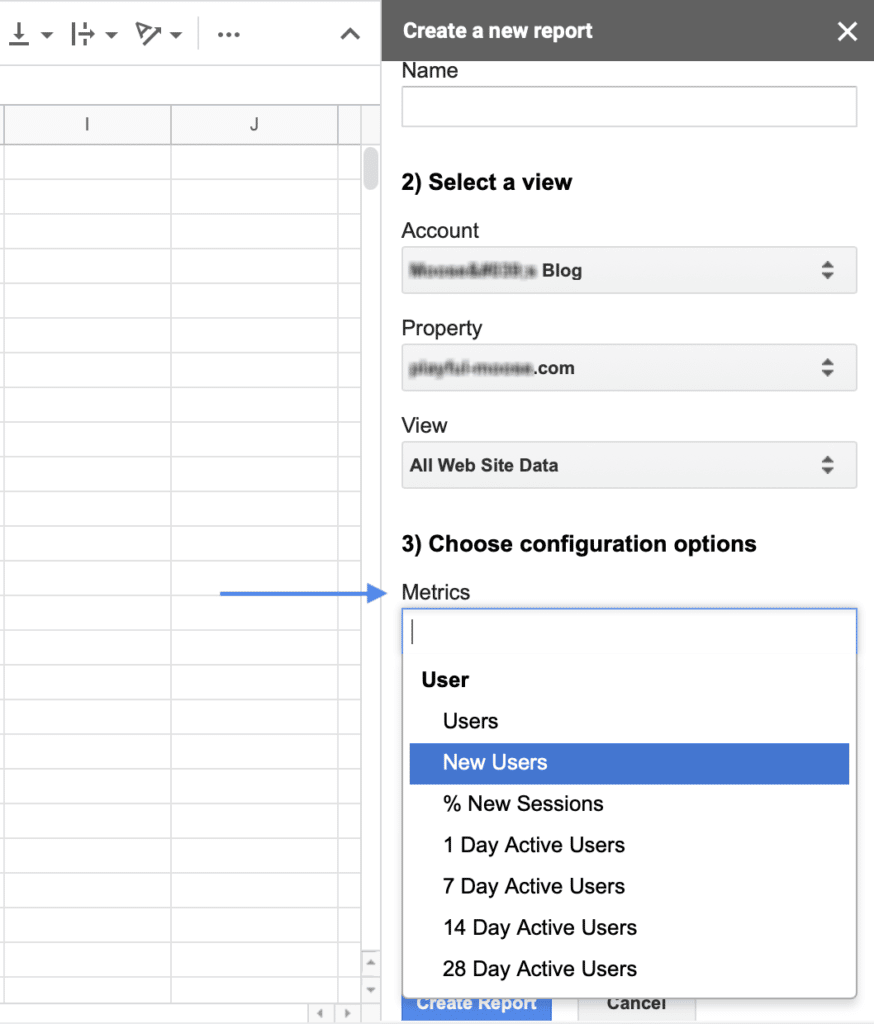
Step 3: Select your report criteria by specifying the fields. Google Analytics provides a dropdown grouped by categories so this should not be too overwhelming.
For this example, we’ll look at the organic traffic from new clientele. When you’re finished defining your criteria, click Create Report at the bottom.
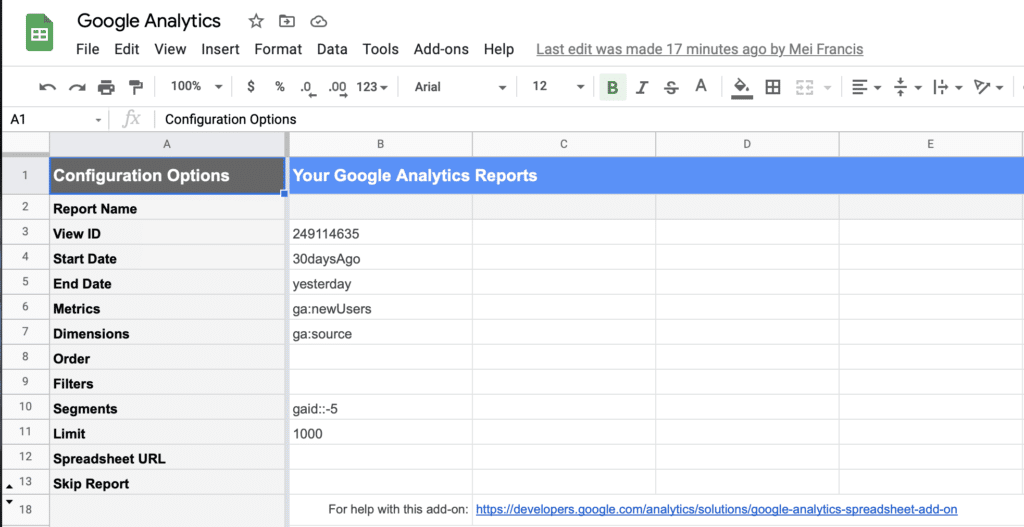
Step 4: After clicking Create Report, you will be taken to the configuration page (this is not the report yet).
You can still make changes within this screen, provided you know the operators. Any new consecutive report will be reflected here as a new column.
Step 5: Once you’re happy with your configuration page, you can finally run the report. Go to Add-ons on the menu, select Google Analytics, then click Run reports.
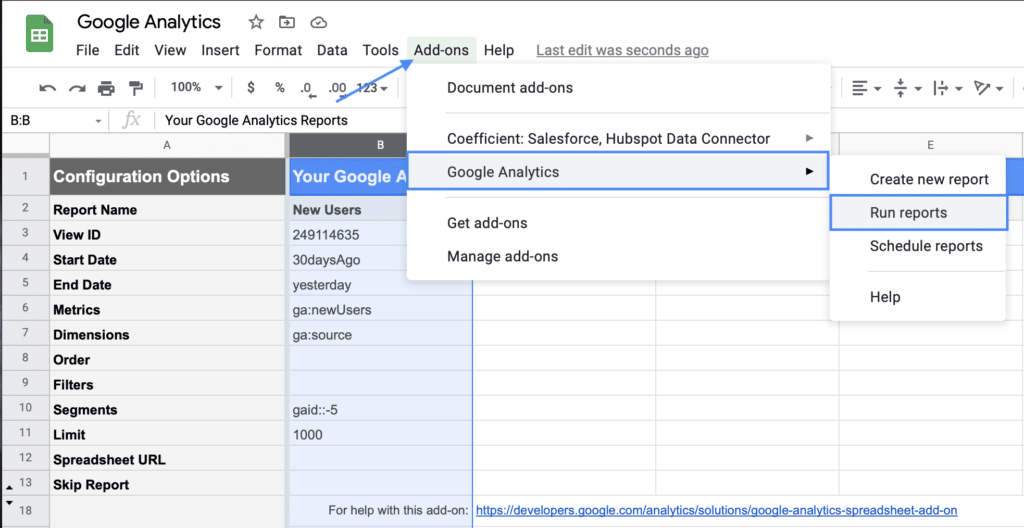
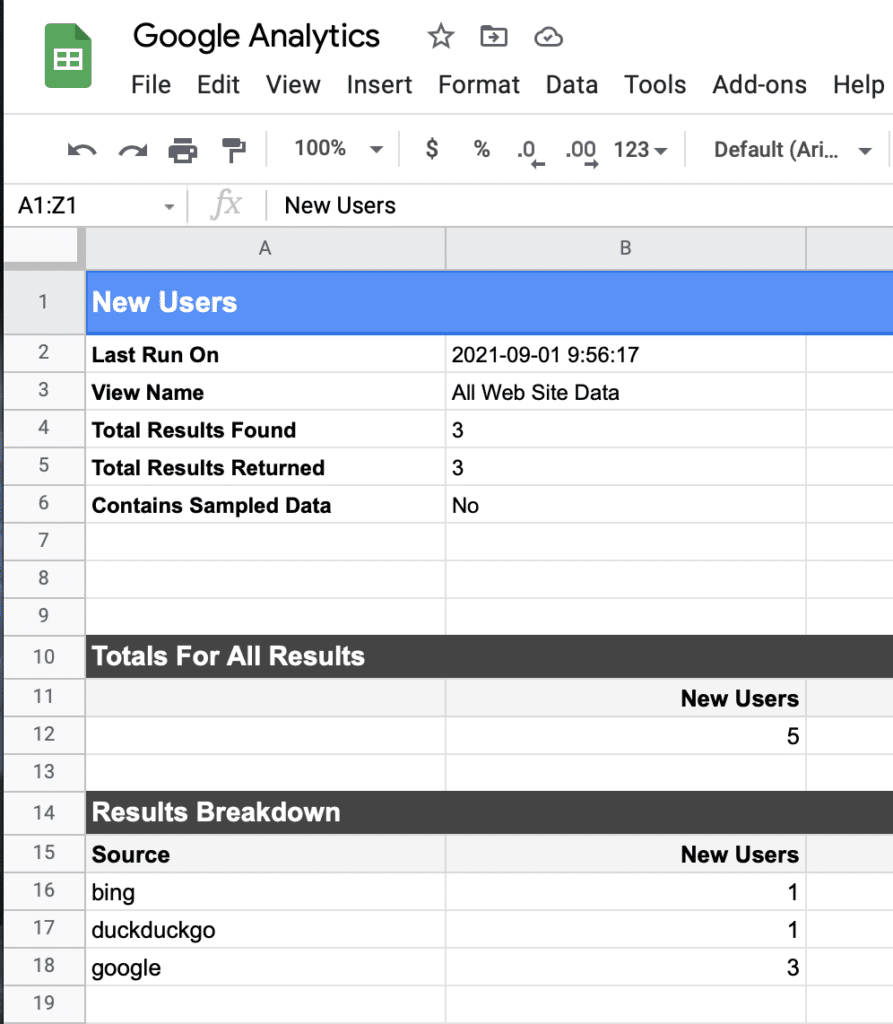
There you have it. Your report might look something like the sample below. From here, you can use Google Sheets functions to manipulate the input fields and sort through your information.
Streamline the linking of your Google Analytics data to Google Sheets
While there are many different options on the market to help you take more control over your online traffic information, you want to go with the most efficient, error-proof, and time-saving solution.
Leverage connecting your Google Analytics data with Google Sheets to simplify extracting useful, actionable insights from your data.
You can supercharge this further by using Coefficient’s powerful solutions with automated features so handling your Google Analytics data doesn’t have to be a long, complex process.
Pull up Google Analytics data into your Google spreadsheets without breaking a sweat and set up your imported datasets to auto-refresh so you won’t need to repeat your analyses.
This makes generating reports, tracking data, and creating everything, from learning how to build an executive dashboard to automating snapshots faster and easier.
With Coefficient, you can have your data work for you, not the other way around!
Try Coefficient for free today.


