
The GOOGLEFINANCE function is a powerful tool in Google Sheets that lets you access current stock prices, currency conversion rates, and historical data for securities, directly inside your Google spreadsheet.
GOOGLEFINANCE is ideal for researching investment opportunities and performing financial analysis in Google Sheets.
This blog will show you how to use the GOOGLEFINANCE function, through examples, use cases, and step-by-step guides. Also, check out the video tutorial below for a full walkthrough of the function.
Video Tutorial: How to Use GOOGLEFINANCE in Google Sheets
What is the GOOGLEFINANCE Function in Google Sheets?
GOOGLEFINANCE is a Google Sheets function that tracks real-time financial market trends, stock updates, and currency information.
The function enables you to reference ticker symbols from stock exchanges to automatically fetch stock data. GOOGLEFINANCE can also retrieve current and historical financial data from Google Finance.
GOOGLEFINANCE has a broad set of use cases. The function allows you to:
- Research market opportunities
- Monitor your financial portfolio
- Convert currencies
- Predict future stock trends through forecasting methods
- Perform competitive analysis
Our customers typically create visualizations, generate reports, and build dashboards by blending GOOGLEFINANCE data with real-time business data imported into Google Sheets with Coefficient.
GOOGLEFINANCE Function Syntax
The GOOGLEFINANCE function has the following syntax:
GOOGLEFINANCE(ticker, [attribute], [start_date], [end_date], [interval])
Here’s a breakdown of the syntax:
- ticker is the ticker symbol of the stock you want to retrieve data for. This includes the initials representing both the company and the stock exchange. For instance, “NASDAQ:NFLX” (“MARKET:COMPANY”) refers to Netflix on the NASDAQ exchange. You can easily find the correct initials for stocks and exchanges by searching for them in Google Finance.
- attribute is an optional single-string parameter (“price” by default) that specifies the ticker-related data you want to access. Attribute parameter strings can include “high”, “price”, “volume”, and “low”. Learn all the GOOGLEFINANCE attributes here.
- start_date specifies the start date for the stock data. You can use this optional parameter to obtain historical stock information
- end_date specifies the end date for the stock data. You can also specify the number of days from the start_date as your end_date.
- interval is another optional parameter for fetching historical data. The parameter specifies the intervals between dates. You can use “daily” or “weekly” as your interval parameter.
For GOOGLEFINANCE to work, you need to include the ticker parameter. The ticker and the attribute parameters must be enclosed in quotation marks.
GOOGLEFINANCE Function in Google Sheets: Step-by-Step Walkthrough
Here are some curated examples on how to leverage the GOOGLEFINANCE function, based on popular use cases.
1. Current Stock Data
Fetching current stock data is simple with GOOGLEFINANCE. All you need to do is perform the following steps.
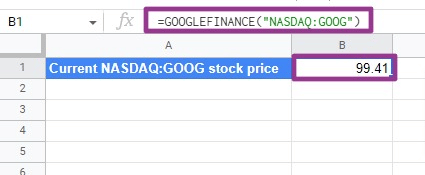
Let’s use Google’s stock for the purposes of this example, which is listed on the NASDAQ. Your formula will look like this:
=GOOGLEFINANCE(“NASDAQ:GOOG”).
The formula above only includes the required parameter — ticker — with no other specified optional parameters. That means the attribute parameter is set to price by default.
This will return the stock’s current price, as shown below:
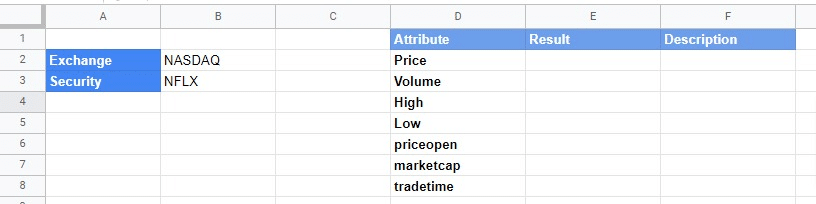
Now let’s expand this example to retrieve the current day’s trading volume, price, and lowest and highest rates for Netflix’s stock.
This time, you’ll need to include the attributes you want in the second parameter (attribute).
First, let’s create a table that lists the attributes you want to fetch for Netflix’s stock.
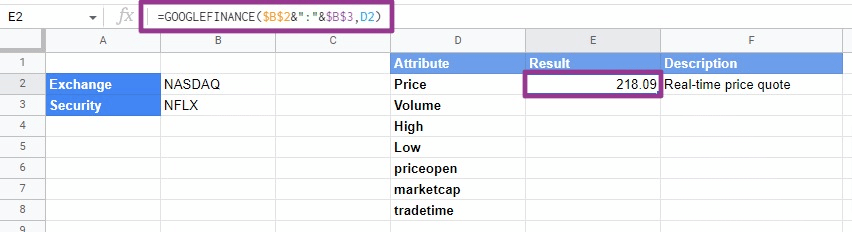
Now you can return the results for “Price” this way:
- Select cell E2 and type in =GOOGLEFINANCE(
- Provide the ticker parameter (cell reference $B$2″:”$B$3 in this example)
- Add a comma
- Include the attribute argument (cell reference D2 in this scenario).
Your complete formula should look like this:
=GOOGLEFINANCE($B$2&”:”&$B$3,D2)
The formula should return the stock’s real-time price.
Using absolute references for the ticker parameter will streamline the rest of the formulas. Now you can simply drag down the formula in E2 to fill in the rest of the cells.
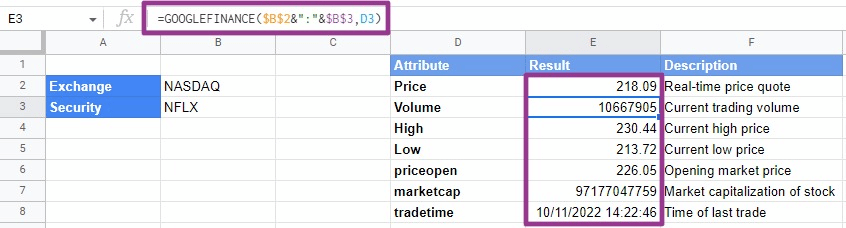
You must use a concatenation operator (&) in the first parameter to list the exchange (B2), followed by a colon (:), and the reference containing the stock ticker symbol (B3). This is necessary because the formula used two separate cell references to create the ticker argument.
Use AI to Generate GOOGLEFINANCE Formulas
You can also use Coefficient’s free Formula Builder to automatically create the formulas in above example or any of the more advanced formulas below. To use Formula Builder, you need to install Coefficient. The install process takes less than a minute.
You can get started for free right from our website.
Accept the prompts to install. Once the installation is finished, return to Extensions on the Google Sheets menu. Coefficient will be available as an add-on.
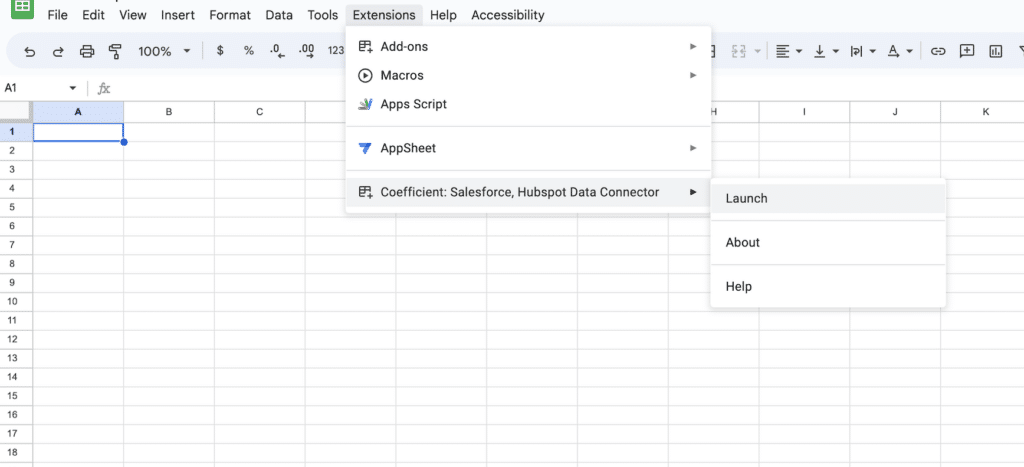
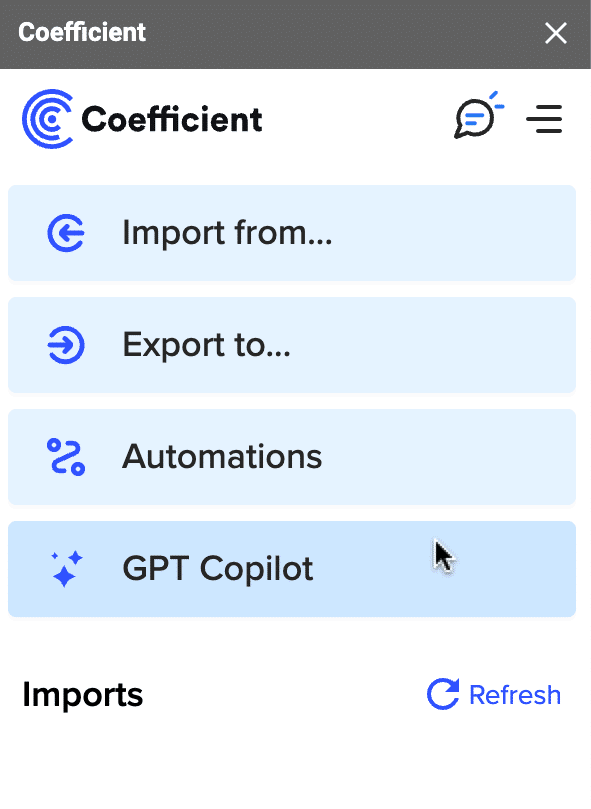
Now launch the app. Coefficient will run on the sidebar of your Google Sheet. Select GPT Copilot on the Coefficient sidebar.
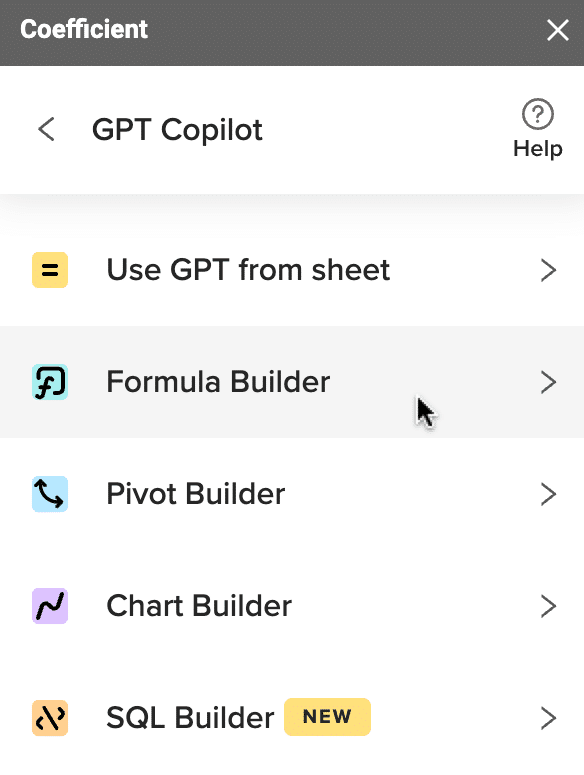
Then click Formula Builder.
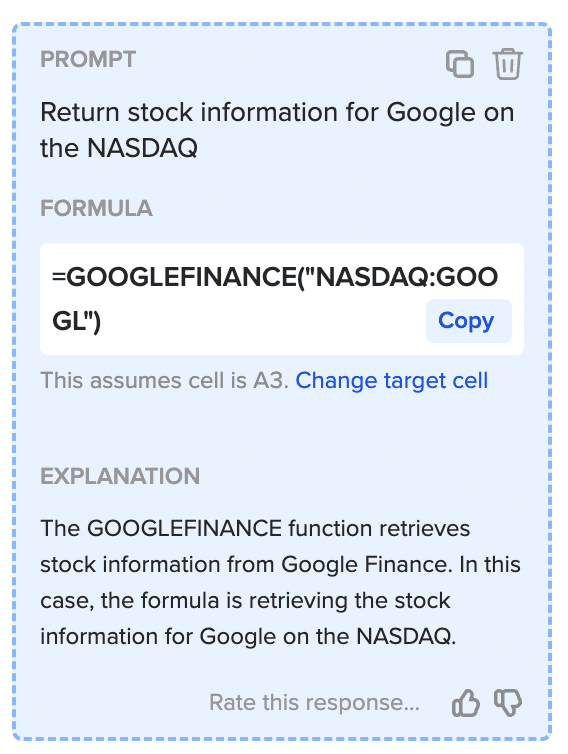
Type a description of a formula into the text box. For this example, type: Return stock information for Google on the NASDAQ.
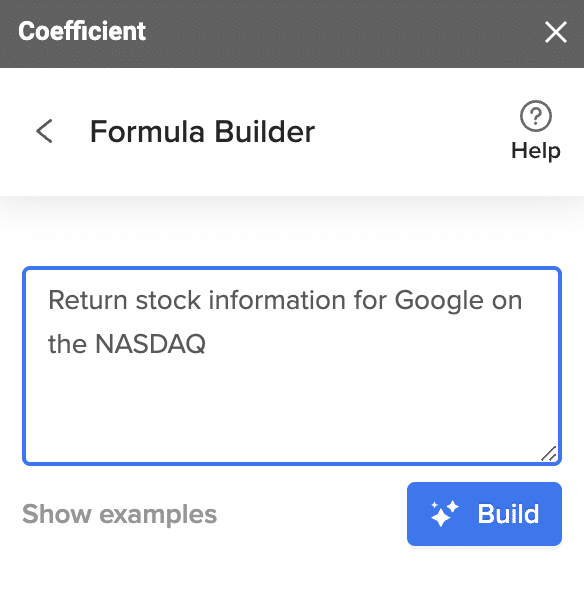
Then press ‘Build’. Formula Builder will automatically generate the formula from the first example.
2. Historical Stock Data
You can capture historical stock data with the third and fourth parameters of the GOOGLEFINANCE function (start_date and end_date).
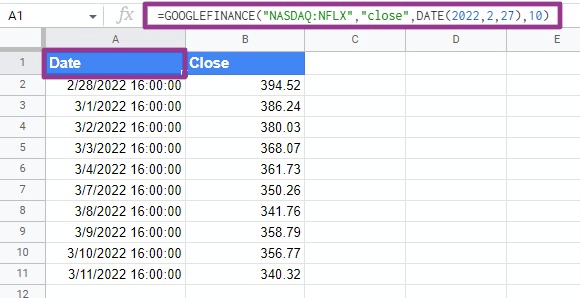
For instance, deploy the formula below to return the closing price of Netflix’s stock over ten days, starting on February 27, 2022.
=GOOGLEFINANCE(“NASDAQ:NFLX”,”close”,DATE(2022,2,27),10)
The third parameter is the start date (DATE(2022,2,27) and the fourth parameter represents the number of days after this date.
The results of the formula should look like this:
Note: if you specify a date value for the fourth parameter, the function interprets it as the end date value.
Let’s do another example. Type in this formula in cell D1:
=GOOGLEFINANCE(B2&”:”&B3,B4,B5,B6,B7)

Supercharge your spreadsheets with GPT-powered AI tools for building formulas, charts, pivots, SQL and more. Simple prompts for automatic generation.

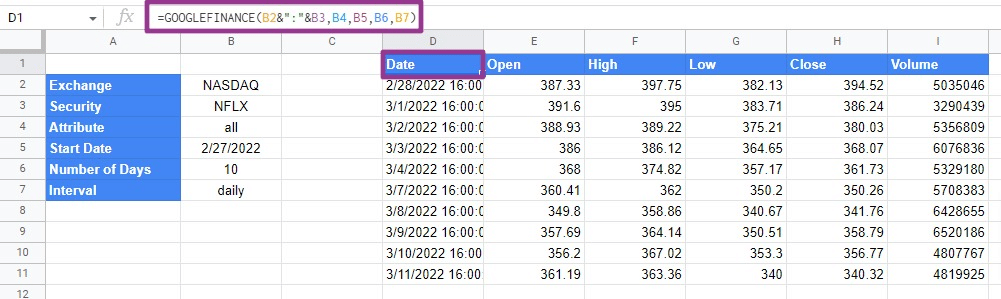
The formula returns ten rows of data. When we specify the attribute parameter as “all”, the GOOGLEFINANCE function returns all five historical data attributes: Open, High, Low, Close, and Trading Volume.
Additionally, specifying the interval parameter as “daily” tells the function to return daily data for ten days, starting from your given date. If no date is given, the formula returns the ten most recent days.
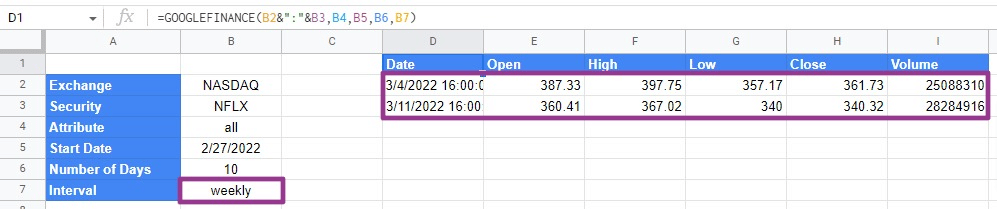
If you want to display the data weekly instead of daily intervals, replace the cell B7 value with “weekly”. This will create two rows of data showing the two weeks within your specified ten-day period.
3. Currency Conversion
The GOOGLEFINANCE function allows you to pull current and historical conversion rates for several global currencies.
As an example, let’s employ GOOGLEFINANCE to produce the conversion rate between the pound and the dollar.
The ticker symbol for the UK pound is GBP, and the US Dollar is USD. So the formula will look like this:
=GOOGLEFINANCE(“Currency:GBPUSD”)
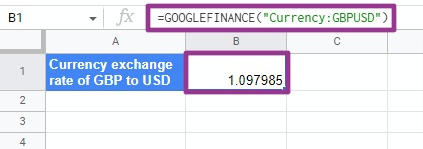
The original currency must come before the target currency. You can find the initials for other currencies by searching on Google Finance.
Now let’s create a general-use formula by harnessing cell ranges and absolute references. Your formula should look like this:
=GOOGLEFINANCE(“Currency:”&B2&B3)
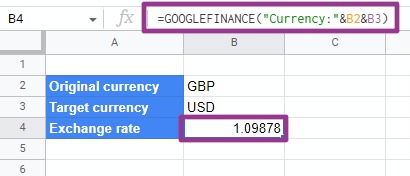
The formula uses two different cell references to create the ticker parameter. It also includes a concatenation operator to combine “Currency”, a colon, the original currency symbol, and the target currency symbol.
Now you can fetch the conversion rate between two currencies simply by replacing the values of cells B2 and B3.
You can also employ this function as part of a currency converter formula, as seen in the following example:
=B4*GOOGLEFINANCE(“Currency:”&B2&B3)
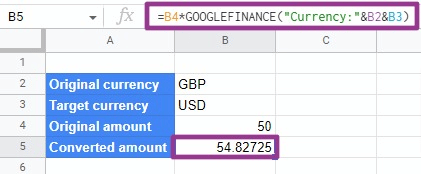
The formula multiplies a value in pounds (50) with the exchange rate between pounds and dollars (1.09878). The result gives you the value in dollars (54.82725)
Simply replace the currency symbols in cells B2 and B3 to create a converter for other currencies.
4. Import Historical Currency Exchange Rates
The GOOGLEFINANCE function can also return historical exchange rates between two currencies over a given period.
To do this, you must specify the second, third, and fourth parameters in your GOOGLEFINANCE formula.
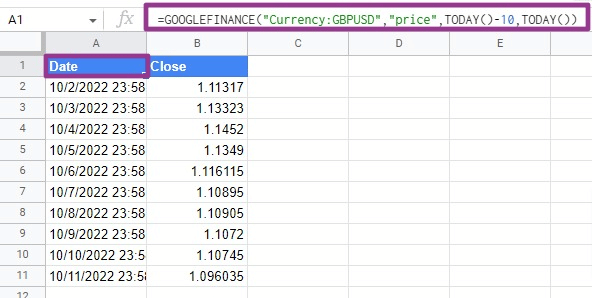
In the example below, the formula calculates the historical exchange rates of pounds to dollars for the last ten days.
=GOOGLEFINANCE(“Currency:GBPUSD”,”price”,TODAY()-10,TODAY())
The general-use version of the formula looks like this:
=GOOGLEFINANCE(“Currency:”&B1&B2,”price”,TODAY()-10,TODAY(),”Daily”)
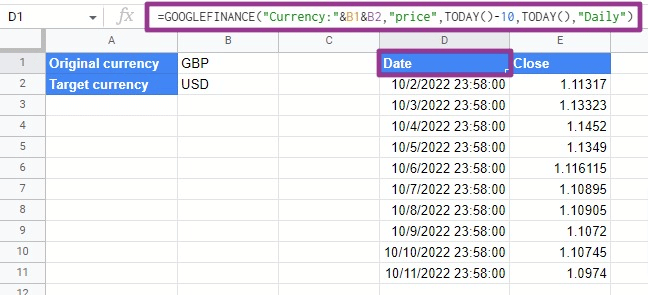
You’ll see two columns (Date and Close), showing the dates and closing exchange rate for each day. You can add “weekly” as the fifth parameter to identify historical currency exchange rate data by week.
And don’t forget, with Coefficient, you can import live financial data into Google Sheets from any of your company data sources. For instance, you can use Coefficient to pull financial data from QuickBooks into Google Sheets automatically, and blend it with GOOGLEFINANCE data to enhance your financial forecasting.
GOOGLEFINANCE Function: Real-time Stock and Finance Data at Your Fingertips
The GOOGLEFINANCE function is an efficient tool for harnessing real-time and historical data for stocks, currencies, and other financial information in your spreadsheet. You can deploy the function to improve your market knowledge, investment strategies, and financial operations in Google Sheets.
Plus, with Coefficient, you can combine this stock and finance information with real-time data from your business systems. Try Coefficient for free to augment your financial insights and analysis in Google Sheets.


