Testimonial

"Coefficient's Google Sheets templates are the next step in spreadsheet evolution–connected spreadsheets. Connected sheets mean faster, better, and more accurate analysis by everyone–especially if you can't code!"
Evan Cover
Director, BI Engineering and Governance, Klaviyo
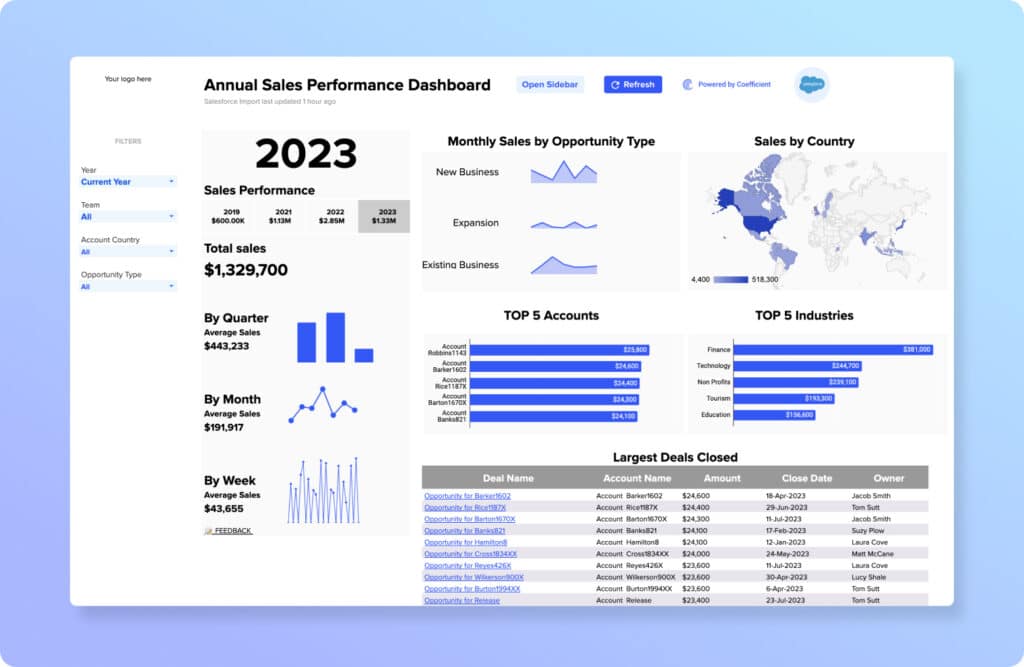
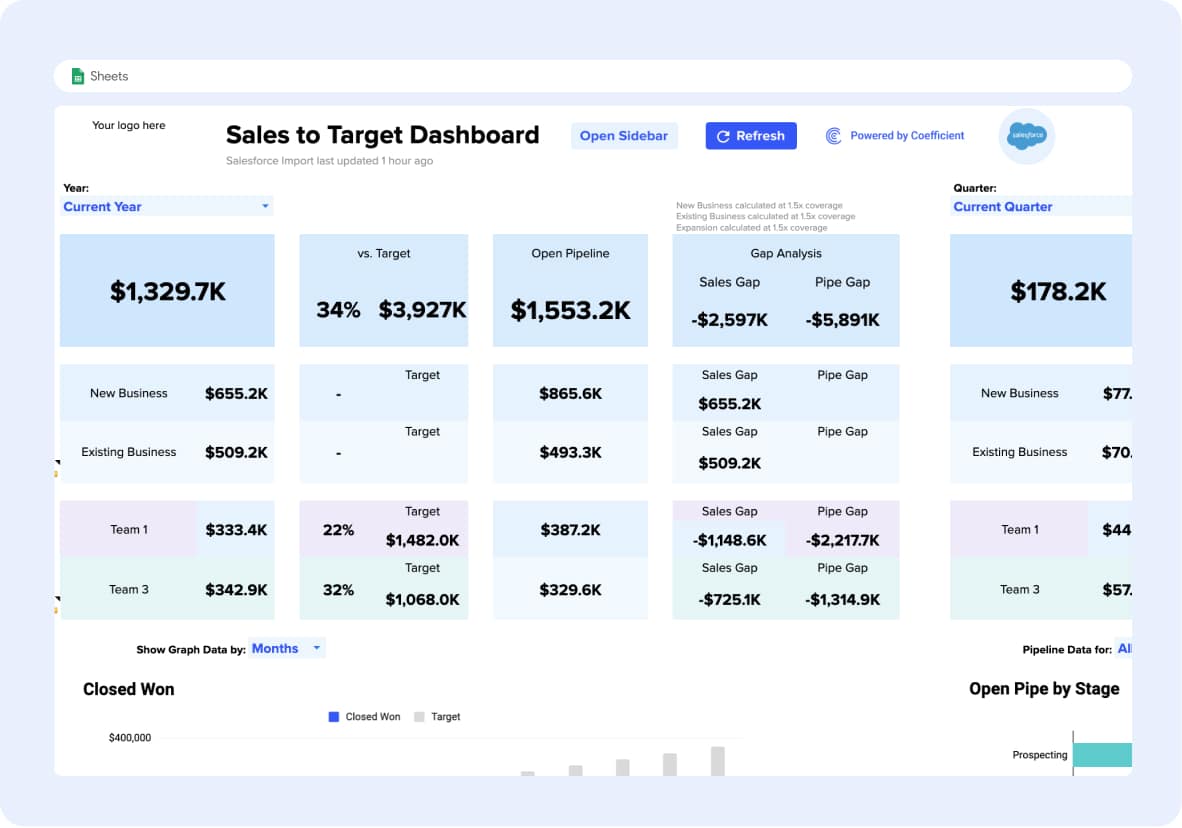
Free, pre-built Sales Operations Dashboards in Google Sheets
Upgrade your toolset instantly with this free starter dashboard package with all of the core charts, metrics, and filters you need to monitor performance and grow your sales.
This Sales Ops Package will help you:
- Automatically populate this dashboard with live data from your Salesforce CRM
- Track year-over-year sales results and celebrate growth
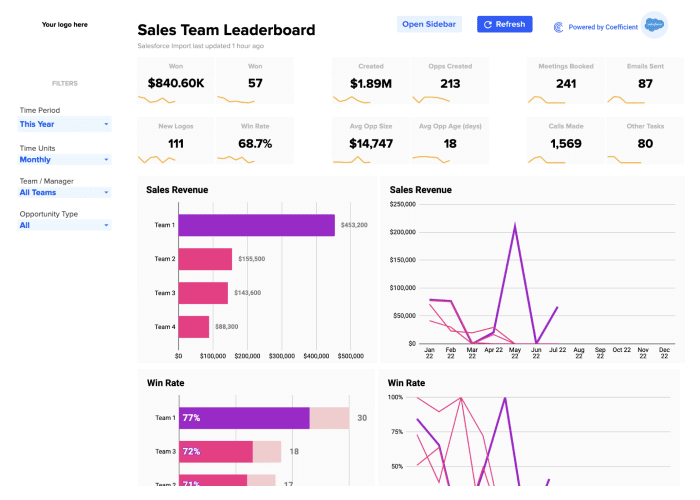
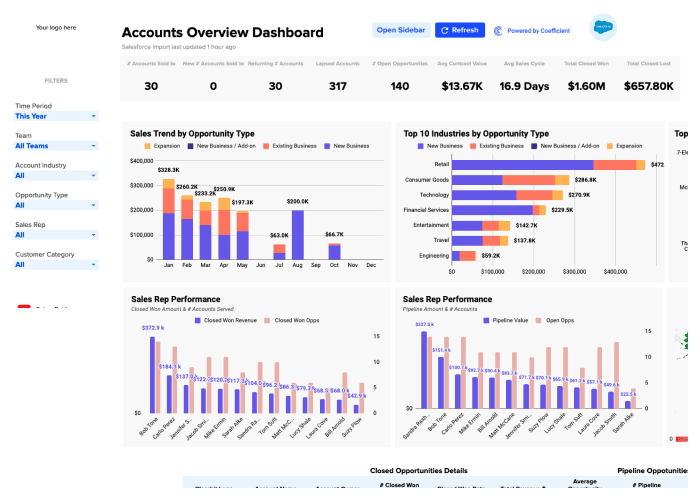
- Instantly gain insights into your top-performing teams, regions, industries, and accounts
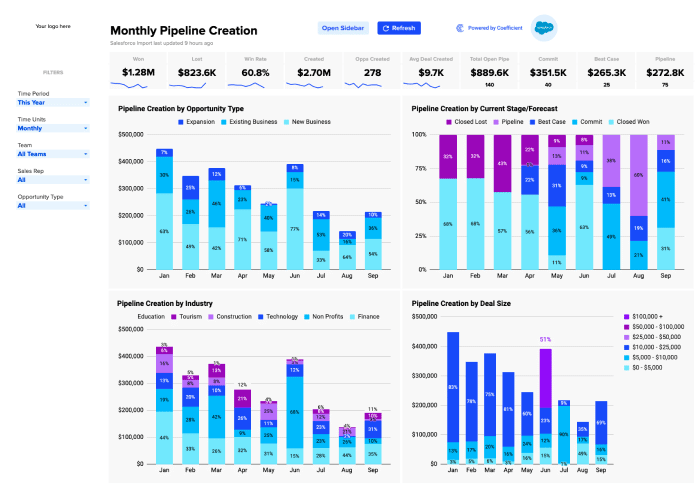
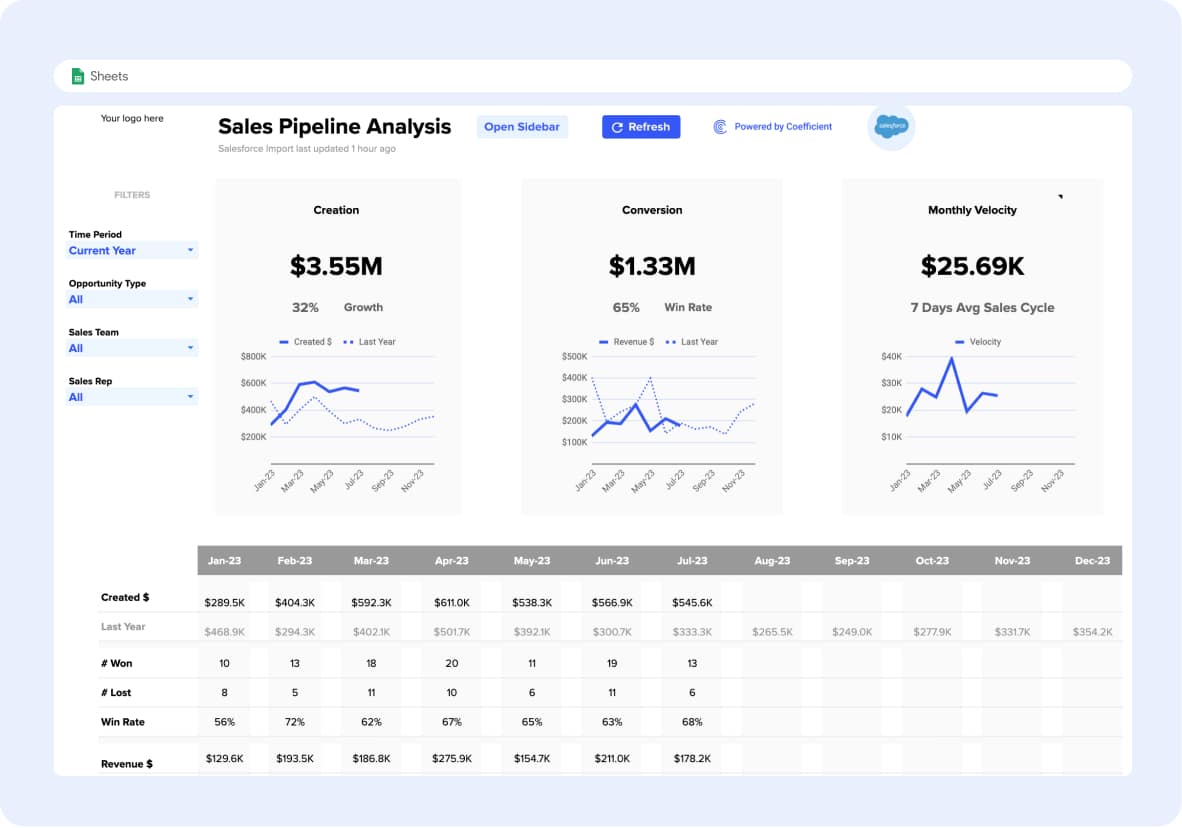
- Monitor your fundamental Sales KPIs, including Pipeline Creation, Win Rates, Average Opp Sizes, and Sales Velocity
- Be your sales team hero with beautiful, sleek dashboards to answer any question that comes your way
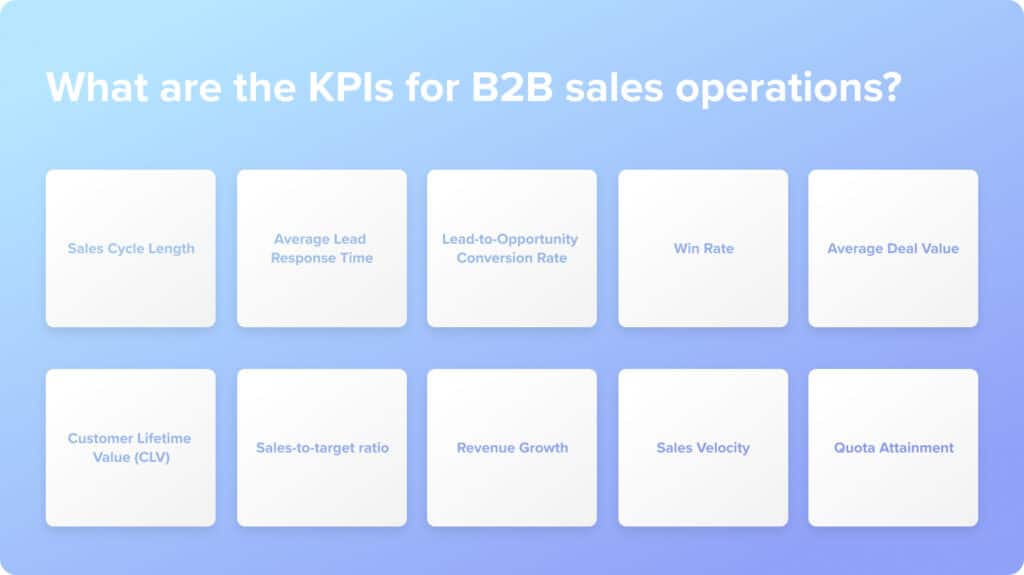
What are the KPIs for B2B Sales Operations?
- Sales Cycle Length measures the average number of days or months it takes to close a deal, from the first interaction with the prospect to winning the deal. It helps measure sales efficiency and create revenue forecasts.
- Average Lead Response Time is the amount of time it takes to follow up with leads after they first contact you. A faster response time can increase the likelihood of converting a lead into a customer.
- Lead-to-Opportunity Conversion Rate measures the percentage of leads converted into opportunities. It helps determine how successful and effective your sales team is at turning leads into opportunities and, ultimately, deals.
- Win Rate represents the percentage of closed deals and helps gauge a sales rep’s overall performance. It can be calculated by including all opportunities or by excluding unqualified leads.
- Average Deal Value is the average amount of money a business makes from a closed deal. It can be calculated by adding up the size of each closed-won opportunity in a specific period and dividing it by the total number of deals made in that timeframe.
- Customer Lifetime Value (CLV) indicates the total revenue a business can expect from a customer during their entire relationship with the company.
- Sales-to-target ratio determines how accurate your sales forecasts are. It can be measured using methods like Mean Absolute Percentage Error (MAPE).
- Revenue Growth tracks the increase in a company’s sales from one period to the next. It’s a key indicator of the effectiveness of sales strategies and tactics.
- Sales Velocity measures the speed at which opportunities move through your pipeline and become revenue. It’s calculated by multiplying the number of opportunities, average deal size, and win rate, then dividing by the length of the sales cycle.
- Quota Attainment measures the percentage of sales reps that reach their sales quota within a given period. It’s a key indicator of the effectiveness of the sales team and the realism of the quotas set.
How Do You Track Revenue Operations Metrics in Salesforce?
Tracking Revenue Operations Metrics in Salesforce involves monitoring a variety of key performance indicators that span across sales, marketing, and customer service departments.
Here’s how you can do it:
- Use Salesforce’s Revenue Operations Analytics template: The Salesforce sales operations template provides a pre-built set of reports and dashboards that you can use to track a variety of revenue metrics, including win rate, pipeline velocity, and forecast accuracy.
- Use Einstein Analytics: Einstein Analytics is a comprehensive cloud-based tool in Salesforce that visualizes and analyzes data from diverse sources. It uses artificial intelligence and machine learning to generate meaningful insights from large data volumes. RevOps professionals can use it to metrics, create custom reports and dashboards, or leverage pre-built templates.
- Integrate with Other Tools: Salesforce can be integrated with other tools, like spreadsheets, to give Sales and Revenue Operations professionals more control over how they track and analyze data. Spreadsheets also allow professionals to combine data from disparate sources for a comprehensive view of performance. With Coefficient, the process of syncing Salesforce data with spreadsheets is effortless and bidirectional, allowing for analysis results to be pushed back into Salesforce. Additionally, Coefficient provides an extensive selection of SalesOps Templates for your convenience.