Data aggregation is the process of collecting and summarizing raw data for analysis. Though the term is typically associated with technical teams, nearly every employee engages in data aggregation at some point.
You’ve probably leveraged aggregated data yourself: yearly revenue, average cost-per-click, monthly organic visits. Data aggregation makes data more informative, efficient, and usable, no matter what your role is. And, if you’re not performing data aggregation yourself, you’re likely experiencing it in your day-to-day. For example, most software and applications today, such as Spotify, Netflix, and corporate apps like RideTandem use data and tracking for personalization that makes our user experiences top-notch.
But data aggregation is often framed in relation to big data, by analysts and engineers, who must contend with hundreds of data sources, machine learning models, and other organizational data components.
This guide will define data aggregation, present example use cases, and suggest various solutions, including for non-technical users.
What is Data Aggregation?
Data aggregation entails collecting raw data into a centralized source, and summarizing the data for analysis.
The term is typically defined from the viewpoint of a technical user. In the case of an analyst or engineer, data aggregation involves ingesting raw data from various databases or data sources into a centralized database.
The raw data is then combined to form aggregate values. A simple example of an aggregate value is a sum or average. This aggregated data is used in analysis, reporting, dashboarding, and other data products to inform decision-making.
Aggregating data can speed up time-to-insight, improve efficiency, and decision-making. Data aggregation also optimizes backend database performance by reducing the number of queries needed to transform data.
Data Aggregation: How It Works
Here’s a closer look at how the two components of data aggregation — collection and summarization — work.
1. Data Collection
Collecting data has never been more challenging for modern enterprises. The average company uses 110 SaaS applications, and only analyzes 12% of the data they have. But companies must centralize and organize all of this data to perform data aggregation for statistical models, AI/ML workflows, and more.
To integrate all these competing data sources, companies often turn to ETL/ELT solutions with pre-built data pipelines. These solutions enable companies to import raw data from their systems into a database (or data warehouse) without requiring them to build pipelines from scratch.
Centralized databases and data warehouses with SQL architectures allow companies to co-locate all of their disparate data sources for aggregation and analysis. Popular databases include MySQL and PostgreSQL, while popular data warehouses include Snowflake, Redshift, and BigQuery.
2. Data Summarization
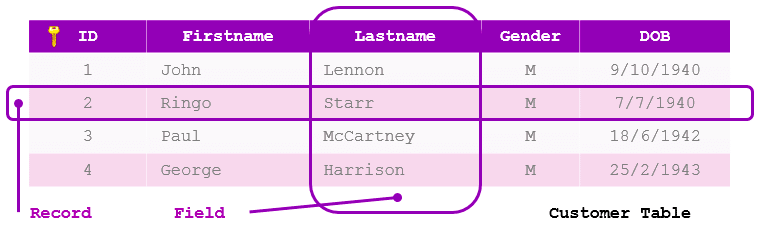
Once the raw data enters the database, SQL queries are run to summarize the data into aggregate values. Essentially, rows (records) in database tables are combined into a row of aggregate data. This row of aggregate data represents totals or summary statistics, such as sums or averages.
Data aggregation speeds up data analysis and improves operational efficiency. It enables data and BI specialists to access more data, faster, rather than combining and analyzing scattered datasets. On the operations side, data aggregation improves database performance by eliminating the need to continuously query individual database records.
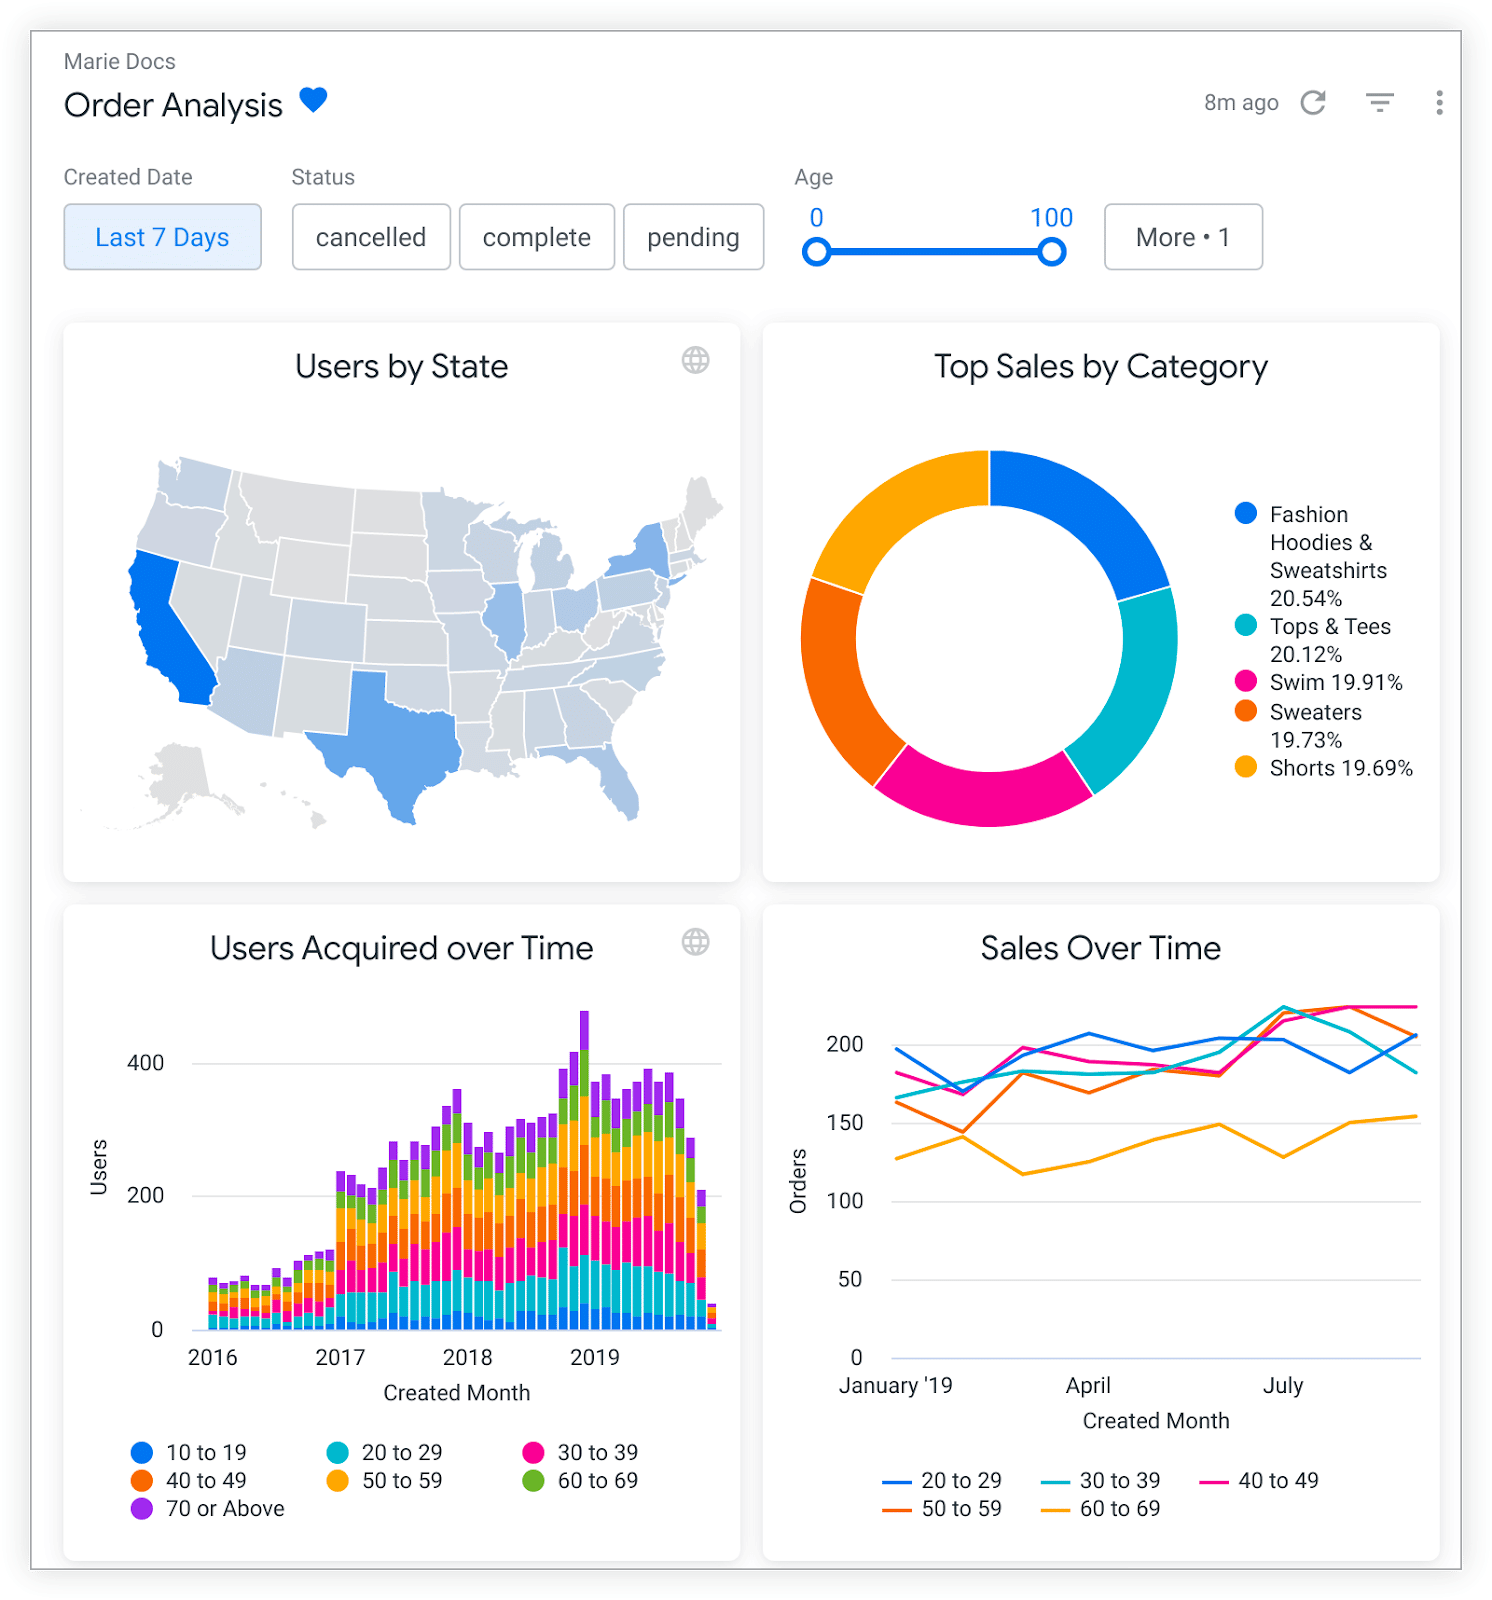
Once the data is aggregated, the summarized values are used in data analysis, dashboarding, modeling, and more, to generate insights. In addition to streamlining analytics, aggregated data also offers a high-level view into important metrics across visualizations and reports. This provides decision-makers with the information they need to act decisively.
Data Aggregation for Business Users
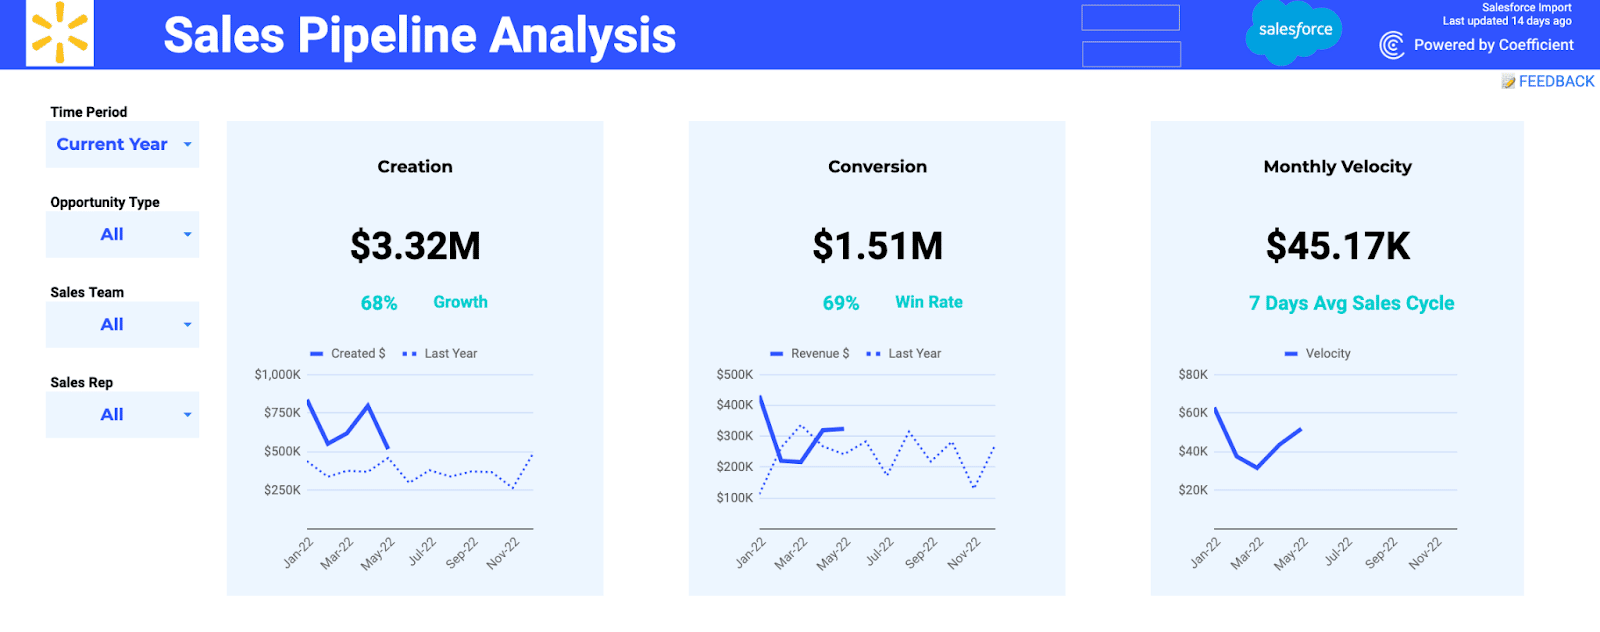
However, this narrow definition of “data aggregation” typically excludes the kind that occurs every day among business users. SalesOps managers aggregate data all the time. And their objective is the same: to create reports and dashboards that influence decision-making.
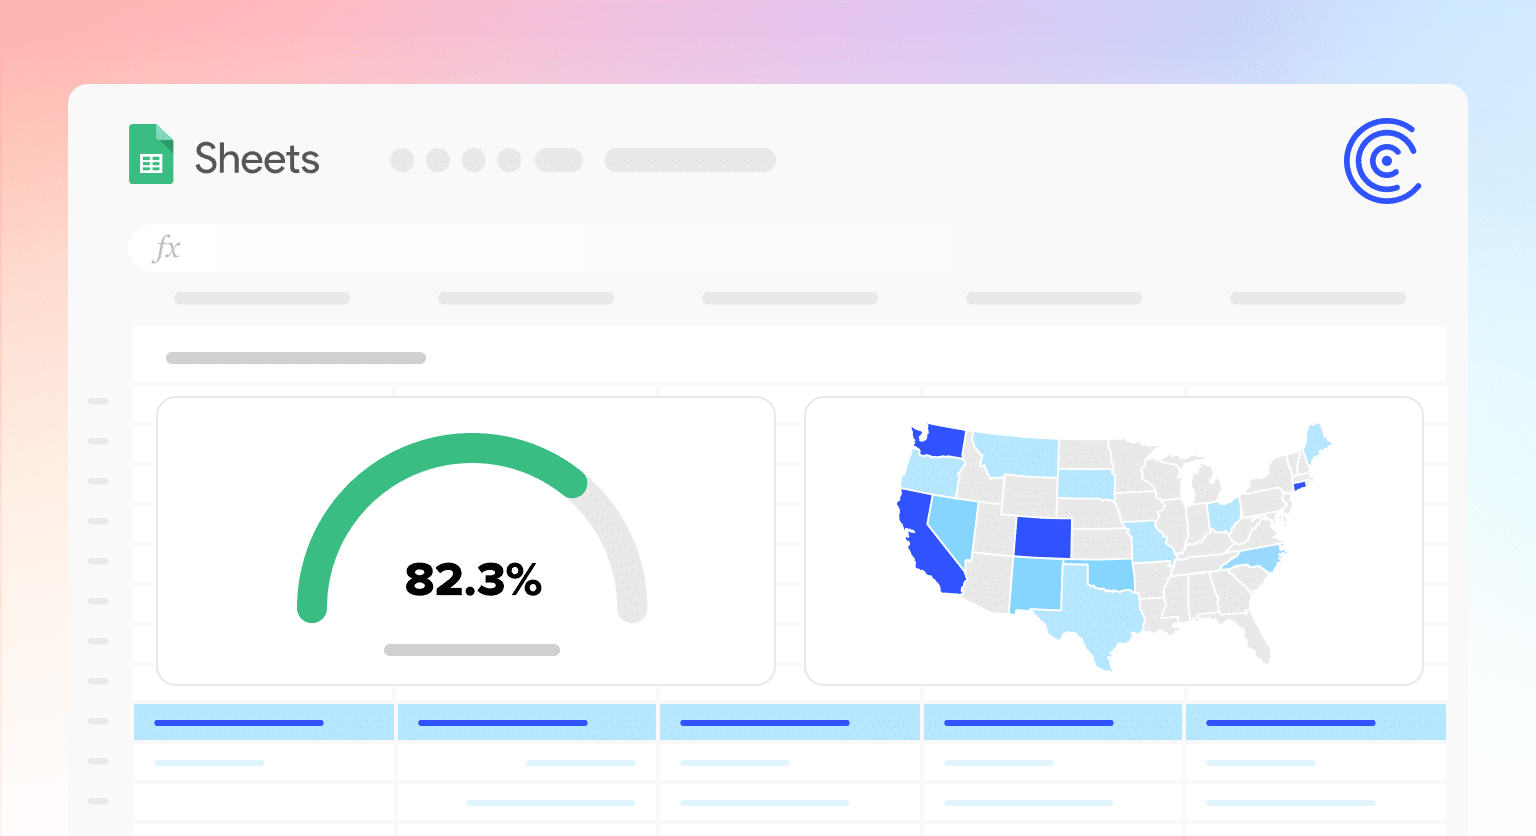
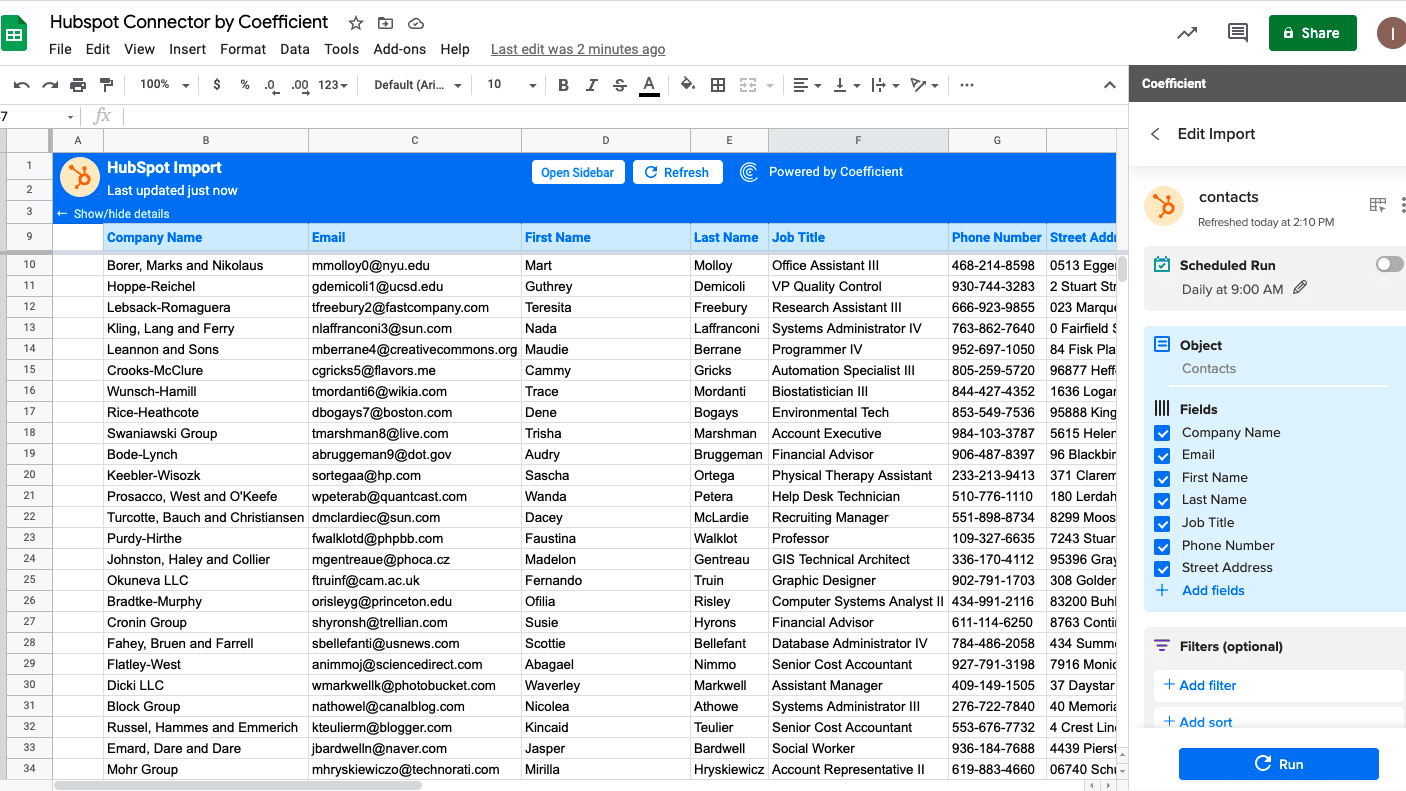
But SalesOps users don’t know SQL, and they don’t have wide-ranging access to the data stack. That’s why they prefer to perform data aggregation in spreadsheets. For instance, we built an entire sales dashboard template in Google Sheets (it’s free to use, by the way).
The problem, though, is that SalesOps managers cannot import real-time data into their spreadsheets. Historically, business users have copy-pasted their data into spreadsheets. But the process is time-consuming, and the data becomes stale rapidly, making dashboards instantly out-of-date.
Nevertheless, SalesOps users still find spreadsheets preferable to waiting in the data team’s queue. And with the advent of solutions such as Coefficient, business users can now import real-time data directly into their spreadsheets, eliminating manual copy-and-pasting, and share always-live dashboards with their teams.
Data Aggregation: Examples
Sectors as diverse as healthcare, financial services, and e-commerce all rely on data aggregation for top-level analysis, core analytical functions, and day-to-day tasks. With such broad applications, data aggregation is used across all industries in many diverse ways, including:

Stop exporting data manually. Sync data from your business systems into Google Sheets or Excel with Coefficient and set it on a refresh schedule.

- A SaaS company combining last year’s overall revenue, average deal size, and deals per rep to forecast sales
- A fintech leveraging average date to default, default rate by income, and debt per customer to model risk for loan origination
- An algorithm on an advertising platform using clicks per user, average years of education, and median age to create campaigns for specific demographics
- An advanced statistical model harnessing total population, minimum days sick, and maximum days sick to visualize the virality of a disease
- A marketing team combining email data from Mailchimp and product activity from Amplitude to define success of email onboarding campaigns
These are just a few examples of data aggregation in action. In practice, just about every company utilizes data aggregation to some degree.
Data Aggregation: Tools & Solutions
Additional tools and solutions can help companies with data aggregation, especially if they maintain many different data sources, and need to analyze large volumes of data. Here are some of the top options for different use cases.
Rivery + Snowflake + Tableau
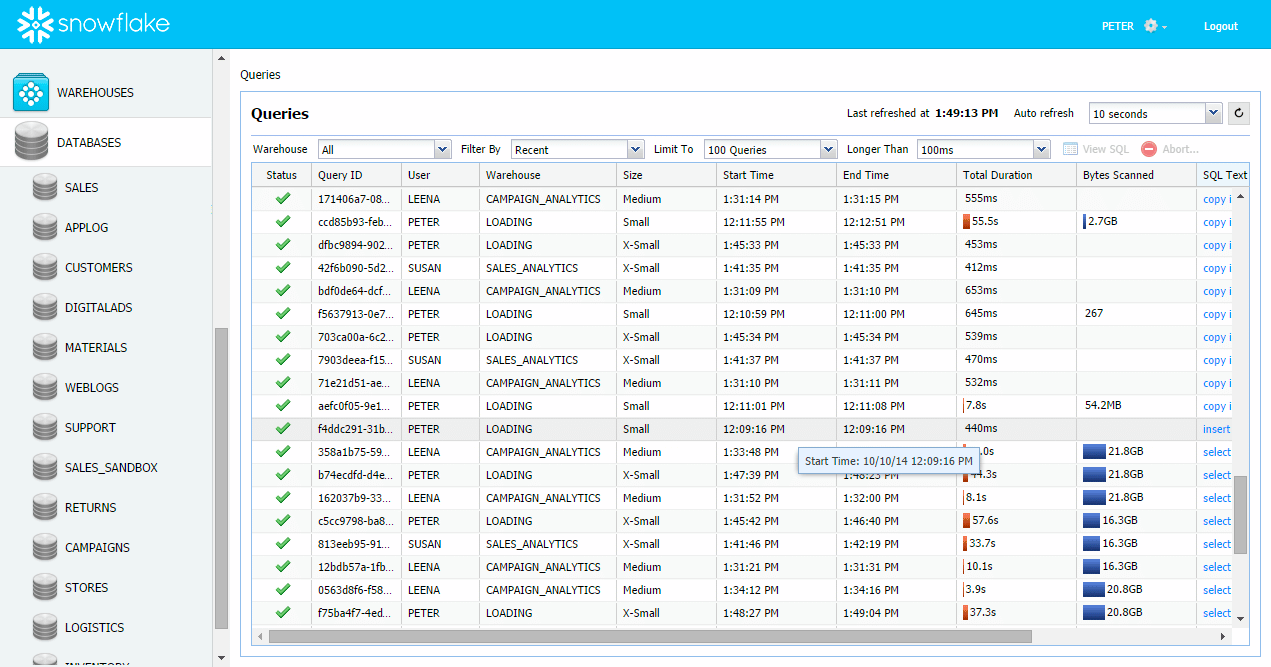
Rivery is an ETL/ELT tool with over 150+ pre-built data connectors. Snowflake is the premier SaaS cloud data warehouse, offering engineers unlimited compute and storage, with a support capacity as well.
Pull data into Snowflake with Rivery’s data connectors, and then summarize the data using Rivery’s data transformation capabilities. Visualize the summarized data using the BI platform Tableau. This configuration makes sense for big data use cases with a BI component.
Databricks Lakehouse Platform + dbt
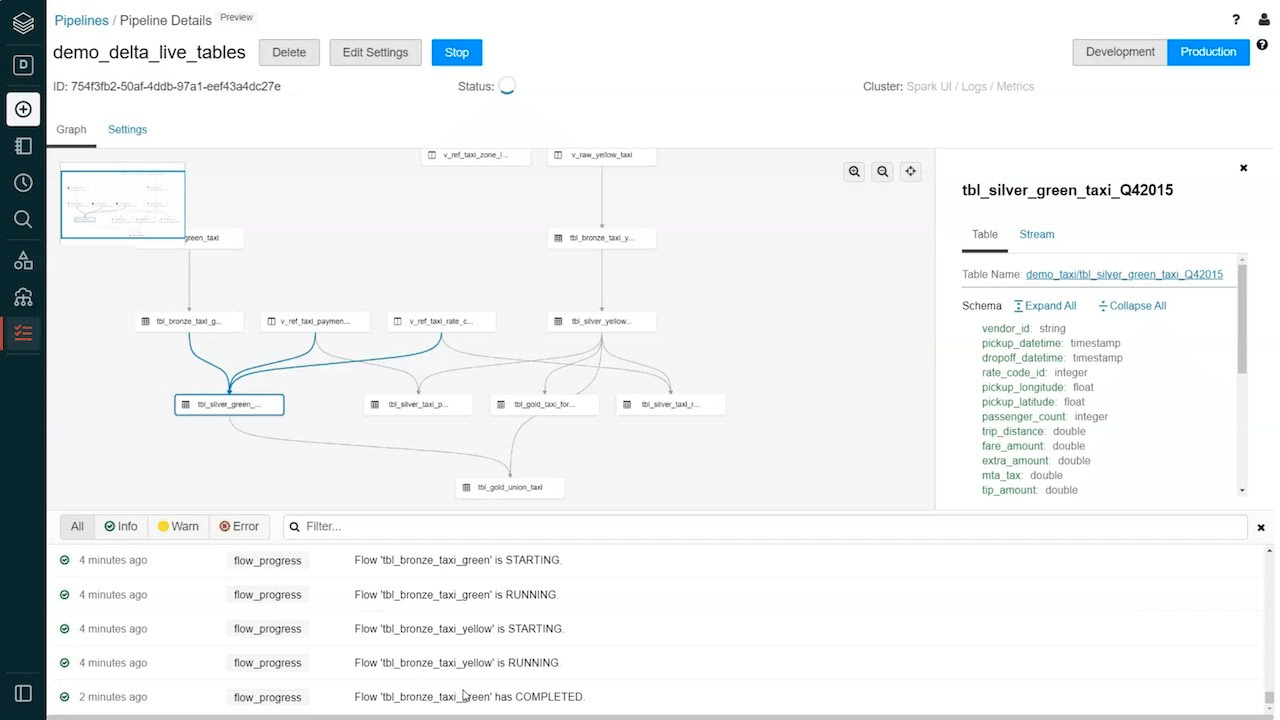
The Databricks Lakehouse Platform unifies data warehousing and AI use cases in a single platform. The Lakehouse Platform is a hybrid combination of data warehouses and data lakes, enabling strong data governance, but with powerful support for unstructured data and AI/ML workflows. Use dbt transformations to aggregate data, and deploy the output flexibly, for analytics, ML models, or anything in between.
Coefficient + Google Sheets
Most business users, such as SalesOps managers, will never need to deploy AI or analyze billions of data points. However, they do need to aggregate and visualize data on a near-daily basis. In many cases, Google Sheets has the analytical and dashboarding functionality they need. But they can’t access real-time data in Google Sheets, turning their spreadsheet into a mini-data silo.
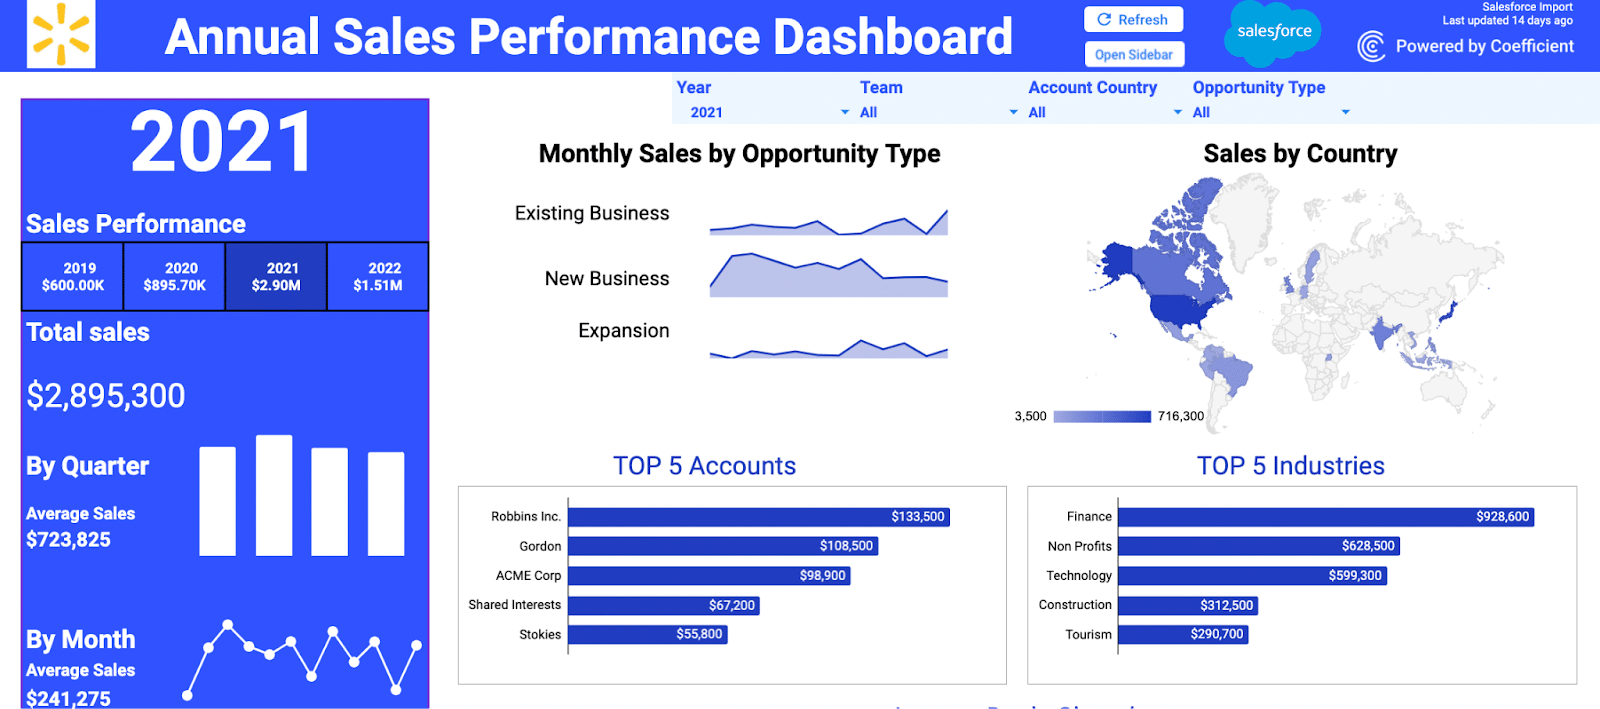
But Coefficient changes this status quo by enabling SalesOps managers to access live data directly in Google Sheets. Coefficient can connect to any business system, pull real-time data into Sheets, and update the data automatically.
With this added layer of connectivity, SalesOps users can utilize the familiar analytical functions in Sheets to easily summarize data and visualize the aggregates in dashboards. SalesOPs managers can even run SQL-like queries against the data using the QUERY function in Google Sheets.
Data Aggregation: Make Your Analysis More Efficient
In a modern enterprise, most team members will leverage aggregated data to solve problems and make decisions. For many business users, the spreadsheet remains the tool of choice for data aggregation. They can easily calculate and visualize sums, averages, and other data summaries directly from the spreadsheet interface.
However, at the level of advanced statistical analysis, data science, and big data, a spreadsheet is not sufficient for data aggregation. In this scenario, data professionals must use their coding skills and modern data stack to streamline analysis and optimize backend query performance against billions of records.
But no matter the use case, the main benefits of data aggregation remain the same. Data aggregation enables all users to better understand the data they’re working with, and make data analysis more efficient.
Try Coefficient’s free plan now to connect live data from all your systems to Sheets, and speed up your data analysis.


